The Spirit Level: Why Greater Equality Makes Societies Stronger (28 page)
Read The Spirit Level: Why Greater Equality Makes Societies Stronger Online
Authors: Richard Wilkinson,Kate Pickett
Tags: #Social Science, #Economics, #General, #Economic Conditions, #Political Science, #Business & Economics

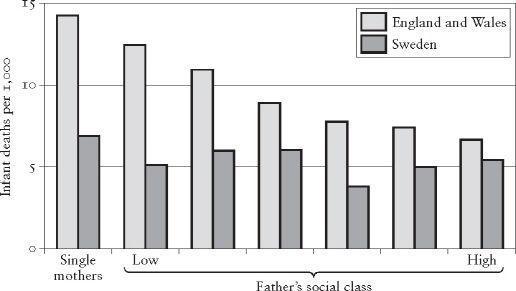
Another similar study compared infant mortality rates in Sweden with England and Wales.
318
Infant deaths were classified by father’s occupation and occupations were again coded the same way in each country. The results are shown in Figure 13.4. Deaths of babies born to single parents, which cannot be coded by father’s occupation, are shown separately. Once again, the Swedish death rates are lower right across the society. (Note that as both these studies were published some time ago, the actual death rates they show are considerably higher than the current ones.)

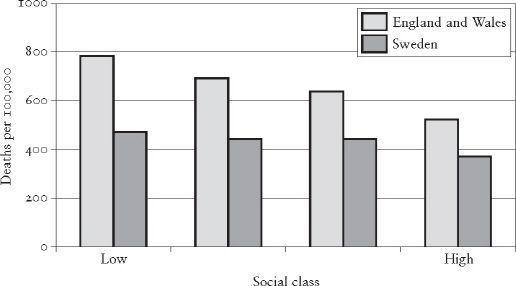
Figure 13.3
Death rates among working-age men are lower in all occupational classes in Sweden compared to England and Wales.
317

Figure 13.4
Infant mortality rates are lower in all occupational classes in Sweden than in England and Wales.
318
Comparisons have also been made between the more and less equal of the fifty states of the USA. Here too the benefits of smaller income differences in the more equal states seem to spread across all income groups. One study concluded that ‘income inequality exerts a comparable effect across all population subgroups’, whether people are classified by education, race or income – so much so that the authors suggested that inequality acted like a pollutant spread throughout society.
319
In a study of our own, we looked at the relationship between median county income and death rates in all counties of the USA.
8
We compared the relationship between county median income and county death rates according to whether the counties were in the twenty-five more equal states or the twenty-five less equal states. As Figure 13.5 shows, in both the more and less equal states, poorer counties tended – as expected – to have higher death rates. However at all levels of income, death rates were lower in the twenty-five more equal states than in the twenty-five less equal states. Comparing counties at each level of income showed that the benefits of greater equality were largest in the poorer counties, but still existed even in the richest counties. In its essentials the picture is much like that shown in Figures 13.3 and 13.4 comparing Sweden with England and Wales. Just as among US counties, where the benefits of greater state equality extended to all income groups, so the benefits of Sweden’s greater equality extended across all classes, but were biggest in the lowest classes.

Figure 13.5
The relation between county median income and county death rates according to whether the counties are in the twenty-five more equal states or the twenty-five less equal states.
Figure 8.4 in Chapter 8, which compared young people’s literacy scores across different countries according to their parents’ level of education (and so indirectly according to the social status of their family of upbringing) also showed that the benefits of greater equality extend throughout society. In more equal Finland and Belgium the benefits of greater equality were, once again, bigger at the bottom of the social ladder than in less equal UK and USA. But even the children of parents with the very highest levels of education did better in Finland and Belgium than they did in the more unequal UK or USA.
A question which is often asked is whether even the rich benefit from greater equality. Perhaps, as John Donne said, ‘No man is an Island’ even from the effects of inequality. The evidence we have been discussing typically divides the population into three or four income or educational groups, or occasionally (as in Figure 13.4) into six occupational classes. In those analyses it looks as if even the richest groups do benefit. But if, when we talk of ‘the rich’, we mean millionaires, celebrities, people in the media, running large businesses or making the news, we can only guess how they might be affected. We might feel we live in a world peopled by faces and names which keep cropping up in the media, but such people actually make up only a tiny fraction of 1 per cent of the population and they are just too small a proportion of the population to look at separately. Without data on such a small minority we can only guess whether or not they are likely to escape the increased violence, drugs or mental illness of more unequal societies. The lives and deaths of celebrities such as Britney Spears, John Lennon, Kurt Cobain, Marilyn Monroe, the assassinated Kennedy brothers, Princess Diana or Princess Margaret, suggest they might not. What the studies do make clear, however, is that greater equality brings substantial gains even in the top occupational class and among the richest or best-educated quarter or third of the population, which include the small minority of the seriously rich. In short, whether we look at states or countries, the benefits of greater equality seem to be shared across the vast majority of the population. Only because the benefits of greater equality are so widely shared can the differences in the rates of problems between societies be as large as it is.
As the research findings have come in over the years, the widespread nature of the benefits of greater equality seemed at first so paradoxical that they called everything into question. Several attempts by international collaborative groups to compare health inequalities in different countries suggested that health inequalities did not differ very much from one country to another. This seemed inconsistent with the evidence that health was better in more equal societies. How could greater equality improve health unless it did so by narrowing the health differences between rich and poor? At the time this seemed a major stumbling block. Now, however, we can see how the two sets of findings are consistent. Smaller income differences improve health for everyone, but make a bigger difference to the health of the poor than the rich. If smaller income differences lead to roughly the same percentage reduction in death rates across the whole society then, when measured in relative terms, the differences in death rates between rich and poor will remain unchanged. Suppose death rates are 60 per 100,000 people in the bottom class and only 20 per 100,000 in the top one. If you then knock 50 per cent off death rates in all groups, you will have reduced the death rate by 30 in the bottom group and by 10 at the top. But although the poor have had much the biggest absolute decline in death rates, there is still a threefold relative class difference in death rates. Whatever the percentage reduction in death rates, as long as it applies right across society, it will make most difference to the poor but still leave relative measures of the difference unchanged.
We can now see that the studies which once looked paradoxical were in fact telling us something important about the effects of greater equality. By suggesting that more and less equal societies contained similar relative health differentials within them, they were telling us that everyone receives roughly proportional benefits from greater equality. There are now several studies of this issue using data for US states,
8
,
319
,
320
and at least five international ones, which provide consistent evidence that, rather than being confined to the poor, the benefits of greater equality are widely spread.
152
,
315
,
317
,
318
,
321
CAUSALITY
The relationships between inequality and poor health and social problems are too strong to be attributable to chance; they occur independently in both our test-beds; and those between inequality and both violence and health have been demonstrated a large number of times in quite different settings, using data from different sources. But association on its own does not prove causality and, even if there is a causal relationship, it doesn’t tell us what is cause and what is effect.
The graphs we have shown have all been cross-sectional – that is, they have shown relationships at a particular point in time rather than as they change in each country over time. However these cross-sectional relationships could only keep cropping up if somehow they changed together. If health and inequality went their separate ways and passed by only coincidentally, like ships in the night, we would not keep catching repeated glimpses of them in close formation.
There is usually not enough internationally comparable data to track relationships over time, but it has been possible to look at changes in health and inequality. One study found that changes between 1975 and 1985 in the proportion of the population living on less than half the national average income among what were then the twelve members of the European Union were significantly related to changes in life expectancy.
81
Similarly, the decrease in life expectancy in Eastern European countries in the six years following the collapse of communism (1989–95) was shown to be greatest in the countries which saw the most rapid widening of income differences. A longer-term and particularly striking example of how income distribution and health change over time is the way in which the USA and Japan swapped places in the international league table of life expectancy in developed countries. In the 1950s, health in the USA was only surpassed by a few countries. Japan on the other hand did badly. But by the 1980s Japan had the highest life expectancy of all developed countries and the USA had slipped down the league and was well on the way to its current position as number 30 in the developed world. Crucially, Japanese income differences narrowed during the forty years after the Second World War. Its health improved rapidly, overtaking other countries, and its crime rate (almost alone among developed countries) decreased. Meanwhile, US income differences widened from about 1970 onwards.
In Chapter 3 we provided a general explanation of why we are so sensitive to inequality, and in each of Chapters 4–12 we have suggested causal links specific to each health and social problem. We have also looked to see whether there might be other obvious cultural links between countries that do well or among those which do badly. But what other explanation might there be if one wanted to reject the idea of a causal relationship? Could inequality and each of the social problems be caused by some other unknown factor?
Weak relationships may sometimes turn out to be a mere mirage reflecting the influence of some underlying factor, but that is much less plausible as an explanation of relationships as close as these. The fact that our Index is not significantly related to average incomes in either our international test-bed or among the US states almost certainly rules out any underlying factor directly related to material living standards. Our analysis earlier in this chapter also rules out government social expenditure as a possible alternative explanation. As for other possible hidden factors, it seems unlikely that such an important causal factor will suddenly come to light which not only determines inequality but which also causes everything from poor health to obesity and high prison populations.
