Why Growth Matters (25 page)
Read Why Growth Matters Online
Authors: Jagdish Bhagwati

Unsurprisingly, therefore, available studies have recorded projects of zero or even negative social value being undertaken under the scheme. Reporting on the quality of assets created, Sharma (2009) states,
It is difficult to argue emphatically about the quality of assets that have been created because very little information is available on them, but a few examples provided here underscore the problems in terms of the quality of these assets. Ponds were dug in a drought-prone area with scanty rainfall, soil was sandy and had no water retention power and others were without water (Haryana). But, some had become like swimming pools due to heavy expenditure incurred on material and masonry works. (p. 125)
He goes on to add, “A lot of money was spent on digging ponds without conceptualizing factors like catchment area, sources of recharging, technical sanctions, and preparation of detailed estimates. Assets created in Karnataka were not according to specification and quantities executed were not as per the technical sanction.” He notes similar problems in road projects in Orissa, Tripura, West Bengal, and other states.
The NREGA also poses the risk of perverse choice of input mix in agriculture through increased market wage. Just as high effective labor costs of operating in the formal economy have led the firms to opt for capital-intensive products and technologies, a NREGA-induced hike in rural wages will lead to premature shift in favor of capital-intensive farm
products and techniques. While the current empirical evidence on this is limited to press reports, it is only a matter of time before more systematic corroborative evidence should emerge.
Finally, there is likely to be another detrimental long-term impact of NREGA on economic development. Given that the primary purpose of public works is to generate employment and the creation of an asset is largely incidental, the work effort demanded by them is likely to be leisurely.
5
In turn, this would have an adverse impact on the work culture. Eventually work effort is likely to decline even in private employments paying the same wage as the public works.
6
In a similar vein, since public projects discourage the use of any machinery, save simple implements such as shovels, and exclusively provide manual and unskilled work, they offer the workers no scope for skill creation. A yet more detrimental developmental impact is likely to be added disincentive for migration. Because public works under NREGA are confined to rural areas, they require presence in the rural areas and slow down a process of income-improving emigration that is already moving at a snail's pace. A cash transfer that the household can receive even as one of its members migrates to work elsewhere does not suffer from this pitfall.
Adult Nutrition and Food Security
P
olicy initiatives to secure nutritional improvement also raise serious questions. Unlike the concern with the poor alone, this issue is seen as cutting across all classes of the population. In particular, with adult nutrition in mind, many civil society groups now demand an expansion of the public distribution system through right-to-food legislation that would guarantee an adequate quantity of food grains at highly subsidized prices to all the country's citizens.
The concern for adult nutrition has originated primarily in the steady decline recorded in per capita calorie consumption (though a decline in protein intake is also an issue). A 1996 report on nutrition by the National Sample Survey Organization provides some of the early documentation of this trend.
1
Additional data appear in similar follow-up reports.
2
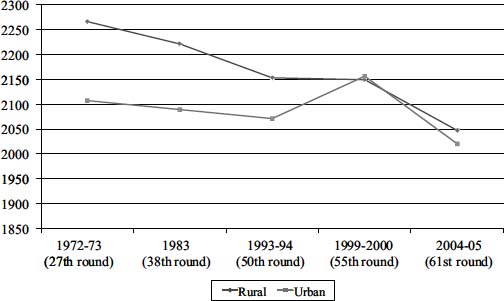
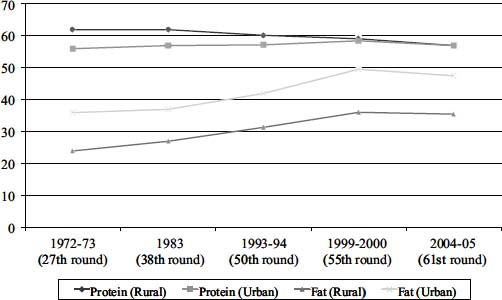
The long-term trend is one of declining calorie consumption in both rural and urban areas, though the trend is steadier in rural areas. Protein intake has shown similar patterns in rural and urban areas, though the intake of fats has steadily climbed.
Figures 15.1
and
15.2
depict these movements graphically.
The trends in calorie consumption and protein and fat intake reflect a shift away from cereals (Deaton and Drèze, 2009, Table 4) to other lower-calorie, lower-protein, more fatty and sugary foods. Such a shift in diet due to increased income from a very low level is likely. Finer grains, white flour, rice, fruits, and oily foods replace coarse grains and whole-wheat flour. Consumption of fruits, fried products, and desserts has seen a steady rise in the past few decades.

Figure 15.1. Average calorie intake per person per day
Source: Drawn using the data in NSSO (2007a, p. v)

Figure 15.2. Grams of protein and fat intake per person per day on average
Source: Drawn using the data in NSSO (2007a, p. v)

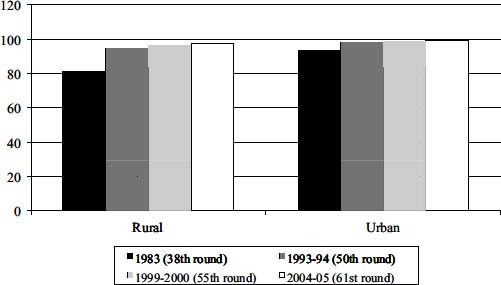
Figure 15.3. Percent of respondents stating they had enough to eat on all days of the year
Source: NSSO (2001b and 2007b)
While activists interpret the trend in calorie consumption as a decisive indication of increased hunger, other evidence seriously questions such a conclusion. Thus, when directly asked whether they had enough to eat every day of the year, successive rounds of the expenditure surveys of the National Sample Survey Organization show increasing proportions of the respondents answering in the affirmative. In the 1983 expenditures survey, only 81.1 percent of the respondents in the rural areas and 93.3 percent in the urban areas stated that they had enough food every day of the year. But by 2004â2005, these percentages had risen to 97.4 and 99.4 percent, respectively.
3
Figure 15.3
depicts these trends in rural and urban India.
Conceptually, the rising trend in the proportion of the population stating that it had enough to eat throughout the year can be reconciled with the declining trend in calorie consumption once we recognize the factors that explain why there may be a decline in the need for calorie
consumption. For example, greater mechanization in agriculture, improved means of transportation, and a shift away from traditional physically challenging jobs may have reduced the need for physical activity. Likewise, better absorption of food made possible by improved epidemiological environment (better child and adult health and better access to safe drinking water) may have lowered the needed calorie consumption to produce a given amount of energy. Hence, the inference that declining calorie consumption implies increasing malnourishment is not warranted.
Indeed, the interpretation that the decline in calorie consumption represents increased malnourishment is also contradicted by the weight and height trends of adults. According to the National Nutrition Monitoring Bureau surveys, the proportion of people with below-normal body mass index (BMI) fell from 56 percent during 1975â1979 to 33 percent during 2004â2005 for men and from 52 percent to 36 percent for women during the same period (Deaton and Drèze, 2009, Table 10). Deaton and Drèze (2009) also analyze the data on the heights of different cohorts of men and women collected by the second and third rounds of the National Family Health Survey and conclude that later-born adult men and women are taller. They calculate that the rate of increase of height is 0.56 centimeter per decade for men and 0.18 centimeter per decade for women. Thus, even if India continues to do poorly in international comparisons, all trends point to improving and not worsening adult nutrition.
Parenthetically, we note here our puzzlement at the implicit endorsement by Deaton and Drèze (2009, p. 45) of the argument that the declining calorie consumption represents rising poverty.
4
While the declining trends in both calorie consumption and protein intake can be sources of concern, surely poverty is not to be measured by the ex post calorie consumption. It must be measured instead by how many calories the individuals are able to afford
ex ante
. The policy response greatly depends on which measure of poverty we choose.
If we measured poverty by the ex post calorie consumption, we would be tempted to offer free food to Bollywood actresses trying to stay slim on low-calorie diets! If, however, we measured poverty,
correctly in our view, by the amount of calories the individual is able to afford
ex ante
, we would be spared the obvious policy mistakes. Thus, if the decline in calorie consumption turns out to be the result of lack of affordability, the solution would be to improve the purchasing power of the citizenry through growth and redistribution. If instead the decline took place despite sufficient purchasing power and therefore due to ill-informed decision-making, we would want to supply better information, undertake persuasive advertising to “nudge” people into healthy eating, and pass laws requiring fortification of major foods by necessary nutrients.
Regrettably, the dominant view today, aggressively pushed by activists in India and around the world and by influential international organizations, such as the World Health Organization, Food and Agricultural Organization, and the World Bank, is that the decline in calorie consumption represents increased poverty and therefore increased hunger. The fact that more and more people in India are able to afford increased rather than reduced food purchases over time and that the decline in calorie consumption has occurred across all individuals, whether they be rich or poor and whether they be residents in rural or urban areas (Deaton and Drèze 2009, pp. 45â47 and Figures 1 and 2), would suggest, however, that something other than purchasing powerâfor example, reduced need for calorie consumption due to the various factors detailed hereâis behind the change. But the increased-hunger school has conveniently ignored this inconvenient truth.
This diagnosis of malnutrition, that it is due not to poverty and hunger but rather to unhealthy consumption, also implies that the current reliance on the right-to-food legislation, and implementation of further expansion of public distribution of food grains, is misguided.
A bill to this effect has just been approved by the cabinet and soon will be tabled in the Parliament. The bill would provide subsidized grain through the public distribution system to 75 percent of the rural and 50 percent of the urban population. Specified criteria exclude 25 percent
of the rural and 50 percent of the urban population from receiving subsidized food. A minimum of 46 percent of the households in the rural and 28 percent in the urban areas must be priority (i.e., poor) households. The remaining households not falling under the exclusion criteria are designated “general” households. Under the bill, the government would supply 7 kilograms of millet, wheat, or rice per person per month at the prices of 1, 2, and 3 rupees per kilogram, respectively, to priority households. With five persons per household, the quantity of subsidized grain would amount to 35 kilograms per household. The bill also proposes to give a minimum of 3 kilograms of millet, wheat, or rice per person per month at prices not exceeding 50 percent of the respective support prices to general households.
In the case of many beneficiaries who may already be consuming adequate grains with malnutrition, reflecting a lack of balanced diet, as we have argued, such an objective itself is questionable. But even accepting that the increase in grains consumption is a desirable goal, it is unlikely that the proposed program would accomplish it. Given that a private market for food grains offers significantly higher prices than the subsidized prices under the bill, beneficiaries will have the option to buy grains at low prices from the public distribution system and sell it on the private market for cash at a profit.
5
There is no guarantee, therefore, that the program will encourage increased consumption of food grains if the beneficiaries do not see the need for it. Indeed, non-priority beneficiaries (the general households in terms of the definition used in the bill), who would receive only partial supplies from the public distribution system, are likely to cut their purchases kilogram-for-kilogram from the private market. This argument is reinforced by the fact that the ongoing decline in the consumption of calories from cereals has taken place in the presence of an extensive public distribution system providing subsidized wheat and rice.
