Why the West Rules--For Now (27 page)
Read Why the West Rules--For Now Online
Authors: Ian Morris
Tags: #History, #Modern, #General, #Business & Economics, #International, #Economics

The other issue is
where
to measure. You may have been struck while reading the last section by my coyness about just what part of the world I was talking about when I generated numbers for “West” and “East.” I spoke at some points about the United States and at others about Britain; sometimes of China, sometimes of Japan. Back in
Chapter 1
I described the historian Kenneth Pomeranz’s complaints about how comparative historians often skew analysis of why the West rules
by sloppily comparing tiny England with enormous China and concluding that the West already led the East by 1750
CE.
We must, he insisted, compare like-sized units. I spent
Chapters 1
and
2
responding to this by defining West and East explicitly as the societies that have descended from the original Western and Eastern agricultural revolutions in the Hilly Flanks and the Yellow and Yangzi river valleys; now it is time to admit that that resolved only part of Pomeranz’s problem. In
Chapter 2
, I described the spectacular expansion of the Western and Eastern zones in the five thousand or so years after cultivation began and the differences in social development that often existed between core areas such as the Hilly Flanks or Yangzi Valley and peripheries such as northern Europe or Korea; so which parts of the East and West should we focus on when working out scores for the index of social development?
We could try looking at the whole of the Eastern and Western zones, although that would mean that the score for, say, 1900
CE
would bundle together the smoking factories and rattling machine guns of industrialized Britain with Russia’s serfs, Mexico’s peons, Australia’s ranchers, and every other group in every corner of the vast Western zone. We would then have to concoct some sort of average development score for the whole Western region, then do it again for the East, and repeat the process for every earlier point in history. This would get so complicated as to become impractical, and I suspect it would be rather pointless anyway. When it comes to explaining why the West rules, the most important information normally comes from comparing the most highly developed parts of each region, the cores that were tied together by the densest political, economic, social, and cultural interactions. The index of social development needs to measure and compare changes within these cores.
As we will see in
Chapters 4
–10, though, the core areas have themselves shifted and changed across time. The Western core was geographically actually very stable from 11,000
BCE
until about 1400
CE,
remaining firmly at the eastern end of the Mediterranean Sea except for the five hundred years between about 250
BCE
and 250
CE,
when the Roman Empire drew it westward to include Italy. Otherwise, it always lay within a triangle formed by what are now Iraq, Egypt, and Greece. Since 1400
CE
it has moved relentlessly north and west, first to northern Italy, then to Spain and France, then broadening to include
Britain, Belgium, Holland, and Germany. By 1900 it straddled the Atlantic and by 2000 was firmly planted in North America. In the East the core remained in the original Yellow-Yangzi zone right up until 1800
CE,
although its center of gravity shifted northward toward the Yellow River’s central plain after about 4000
BCE
, back south to the Yangzi Valley after 500
CE
, and gradually north again after 1400. It expanded to include Japan by 1900 and southeast China by 2000 (
Figure 3.2
). For now I just want to note that all the social development scores reflect the societies in these core areas; why the cores shifted will be one of our major concerns in
Chapters 4
through
10
.
THE PATTERN OF THE PAST
So much for the rules of the game; now for some results.
Figure 3.3
shows the scores across the last sixteen thousand years, since things began warming up at the end of the Ice Age.
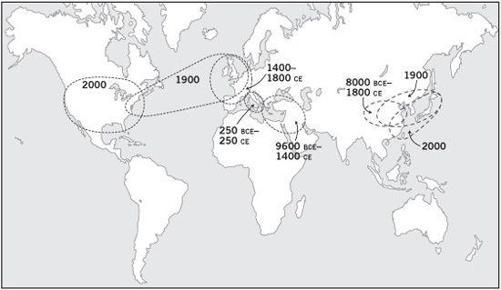
Figure 3.2. Shifting centers of power: the sometimes slow, sometimes rapid relocation of the most highly developed core within the Western and Eastern traditions since the end of the Ice Age
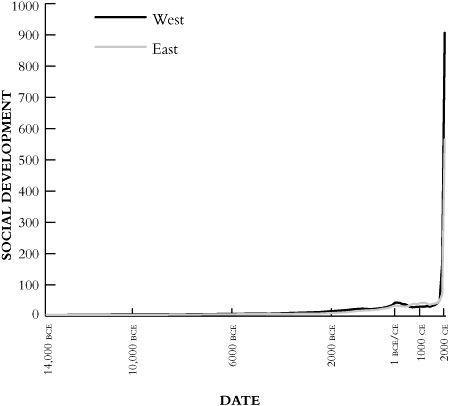
Figure 3.3. Keeping score: Eastern and Western social development since 14,000
BCE
After all this buildup, what do we see? Frankly, not much, unless your eyesight is a lot better than mine. The Eastern and Western lines run so close together that it is hard even to distinguish them, and they barely budge off the bottom of the graph until 3000
BCE
. Even then, not much seems to happen until just a few centuries ago, when both lines abruptly take an almost ninety-degree turn and shoot straight up.
But this rather disappointing-looking graph in fact tells us two very important things. First, Eastern and Western social development have not differed very much; at the scale we are looking at, it is hard to tell them apart through most of history. Second, something profound happened in the last few centuries, by far the fastest and greatest transformation in history.
To get more information, we need to look at the scores in a different way. The trouble with
Figure 3.3
is that the upward swing of the Eastern and Western lines in the twentieth century was so dramatic that to have the scale on the vertical axis go high enough to include the scores in 2000
CE
(906.38 for the West and 565.44 for the East) we have to compress the much lower scores in earlier periods to the point that they are barely visible to the naked eye. This problem afflicts all graphs that try to show patterns where growth is accelerating, multiplying what has gone before, rather than simply adding to it. Fortunately there is a convenient way to solve the problem.
Imagine that I want a cup of coffee but have no money. I borrow a dollar from the local version of Tony Soprano (imagine, too, that this story is set back in the days when a dollar still bought a cup of coffee). He is, of course, my friend, so he won’t charge me interest so long as I pay him back within a week. If I miss the deadline, though, my debt will double every seven days. Needless to say, I fail to show up when the payment is due, so now I owe him two dollars. Fiscal prudence not being my strength, I let another week pass, so I owe four dollars; then another week. Now his marker is worth eight dollars. I skip town and conveniently forget our arrangement.
Figure 3.4
shows what happens to my debt. Just like
Figure 3.3
, for a long time there is nothing much to see. The line charting the interest becomes visible only around week 14—by which time I owe a breathtaking $8,192. On week 16, when my debt has spiraled to $32,768, the line finally pulls free from the bottom of the graph. By week 24, when the mobsters track me down, I owe $8,260,608. That was one expensive cup of coffee.
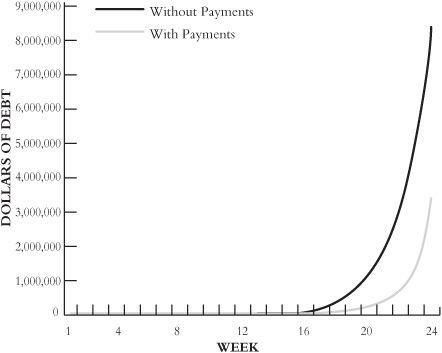
By this standard, of course, the growth of my debt in the first few weeks—from one, to two, to four, to eight dollars—was indeed trivial. But imagine that I had bumped into one of the loan shark’s foot soldiers a month or so after my fateful coffee, when my debt stood at sixteen dollars. Let us also say that I didn’t have sixteen dollars, but did give him a five. Concerned for my health, I make four more weekly payments of five dollars each, but then drop off the map again and stop paying. The black line in
Figure 3.5
shows what happened when I paid nothing, while the gray one shows how my debt grows after those five five-dollar payments. My coffee still ends up costing more than $3 million, but that is less than half what I owed without the payments. They were crucially important—yet they are invisible in the graph. There is no way to tell from
Figure 3.5
why the gray line ends up so much lower than the black.
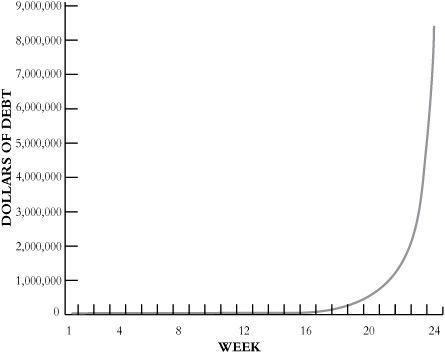
Figure 3.4. The $8 million cup of coffee: compound interest plotted on a conventional graph. Even though the cost of a cup of coffee spirals from $1 to $8,192 across fourteen weeks, the race to financial disaster remains invisible on the graph until week 17.
Figure 3.6
tells the story of my ruin in a different way. Statisticians call
Figures 3.4
and
3.5
linear-linear graphs, because the scales on each axis grow by linear increments; that is, each week that passes occupies the same amount of space along the horizontal axis, each dollar of debt the same space on the vertical axis.
Figure 3.6
, by contrast, is what statisticians call log-linear. Time is still parceled out along the horizontal scale in linear units, but the vertical scale records my debt logarithmically, meaning that the space between the bottom axis of the graph and the first point on the vertical axis covers my debt’s tenfold growth from one to ten dollars; in the space between the first and second points it again expands tenfold, from ten to a hundred dollars; then tenfold more, from a hundred to a thousand; and so on to ten million at the top.
Politicians and advertisers have turned misleading us with statistics into a fine art. Already a century and a half ago the British prime minister Benjamin Disraeli felt moved to remark, “
There are three
kinds of lies: lies, damned lies, and statistics,” and
Figure 3.6
may strike you as proving his point. But all it really does is highlight a different aspect of my debt than
Figures 3.4
and
3.5
. A linear-linear scale does a good job of showing just how bad my debt is; a log-linear scale does a good job of showing how things got to be so bad. In
Figure 3.6
the black line runs smooth and straight, showing that without any payments the size of my debt accelerates steadily, doubling every week. The gray line shows how after four weeks of doubling, my series of five-dollar payments slow down, but do not cancel out, my debt’s rate of growth. When I stop paying, the gray line once again rises parallel to the black one, since my debt is once again doubling every week, but does not end up at quite such a dizzying height.