Why the West Rules--For Now (28 page)
Read Why the West Rules--For Now Online
Authors: Ian Morris
Tags: #History, #Modern, #General, #Business & Economics, #International, #Economics

Figure 3.5. A poor way to represent poor planning: the black line shows the same spiral of debt as
Figure 3.4
, while the gray line shows what happens after small payments against the debt in weeks 5 through 9. on this conventional (linear-linear) graph, these crucial payments are invisible.
Neither politicians nor statistics
always
lie; it is just that there is no such thing as a completely neutral way to present either policies or numbers. Every press statement and every graph emphasizes some aspects of reality and downplays others. Thus
Figure 3.7
, showing social development scores from 14,000
BCE
through 2000
CE
on a log-linear scale, produces a wildly different impression than the linear-linear version of the same scores in
Figure 3.3
. There is much more going on here than met the eye in
Figure 3.3
. The leap in social development in recent centuries is very real and remains clear; no amount of fancy statistical footwork will ever make it go away. But
Figure 3.7
shows that it did not drop out of a clear blue sky, the way it seemed to do in
Figure 3.3
. By the time the lines start shooting upward (around 1700
CE
in the West and 1800 in the East) the scores in both regions were already about ten times higher than they were at the left-hand side of the graph—a difference that was barely visible in
Figure 3.3
.
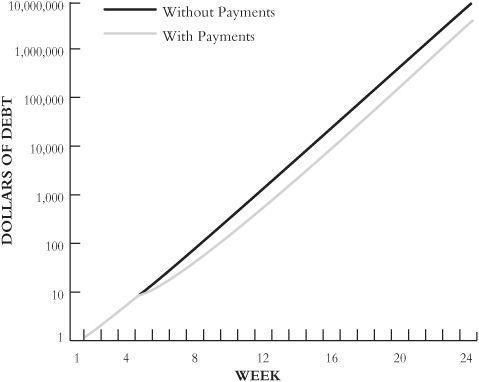
Figure 3.6. Straight roads to ruin: the spiral of debt on a log-linear scale. The black line shows the steady doubling of the debt if no payments are made, while the gray shows the impact of the small payments in weeks 5 through 9 before it goes back to doubling when the payments stop.
Figure 3.7
shows that explaining why the West rules will mean answering several questions at once. We will need to know why social development leaped so suddenly after 1800
CE
to reach a level (somewhere close to 100 points) where states could project their power globally. Before development reached such heights, even the strongest societies on earth could dominate only their own region, but the new technologies and institutions of the nineteenth century allowed them to turn local domination into worldwide rule. We will also, of course, need to figure out why the West was the first part of the world to reach this threshold. But to answer either of these questions we will also have to understand why development had already increased so much over the previous fourteen thousand years.
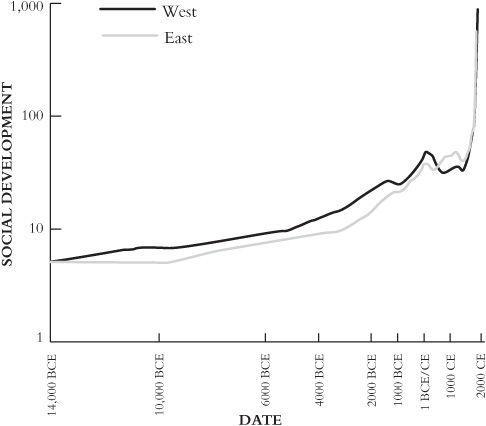
Figure 3.7. The growth of social development, 14,000
BCE
–2000
CE
, plotted on a log-linear scale. This may be the most useful way to present the scores, highlighting the relative rates of growth in East and West and the importance of the thousands of years of changes before 1800
CE.
Nor is that the end of what
Figure 3.7
reveals. It also shows that the Eastern and Western scores were not in fact indistinguishable until just a few hundred years ago: Western scores have been higher than Eastern scores for more than 90 percent of the time since 14,000
BCE.
This seems to be a real problem for short-term accident theories. The West’s lead since 1800
CE
is a reversion to the long-term norm, not some weird anomaly.
Figure 3.7 does not necessarily disprove short-term accident theories, but it does mean that a successful short-term theory will need to be more sophisticated, explaining the long-term pattern going back to the end of the Ice Age as well as events since 1700
CE
. But the patterns also show that long-term lock-in theorists should not rejoice too soon.
Figure 3.7
reveals clearly that Western social development scores have not
always
been higher than Eastern. After converging through much of the first millennium
BCE,
the lines cross in 541
CE
and the East then remains ahead until 1773. (These implausibly precise dates of course depend on the unlikely assumption that the social development scores I have calculated are absolutely accurate; the most sensible way to put things may be to say that the Eastern score rose above the Western in the mid sixth century
CE
and the West regained the lead in the late eighteenth.) The facts that Eastern and Western scores converged in ancient times and that the East then led the world in social development for twelve hundred years do not disprove long-term lock-in theories, any more than the fact that the West has led for nearly the whole time since the end of the Ice Age disproves short-term accident theories; but again, they mean that a successful theory will need to be rather more sophisticated and to take account of a wider range of evidence than those offered so far.
Before leaving the graphs, there are a couple more patterns worth pointing out. They are visible in
Figure 3.7
, but
Figure 3.8
makes them clearer. This is a conventional linear-linear graph but covers just the three and a half millennia from 1600
BCE
through 1900
CE
. Cutting off the enormous scores for 2000
CE
lets us stretch the vertical axis enough that we can actually see the scores from earlier periods, while shortening the time span lets us stretch the horizontal axis so the changes through time are clearer too.
Two things particularly strike me about this graph. The first is the peak in Western scores in the first century
CE,
around forty-three points, followed by a slow decline after 100
CE.
If we look a little farther to the right, we see an Eastern peak just over forty-two points in 1100
CE,
at the height of the Song dynasty’s power in China, then a similar decline. A little farther still to the right, around 1700
CE,
Eastern and Western scores both return to the low forties but this time instead of stalling they accelerate; a hundred years later the Western line goes through the roof as the industrial revolution begins.
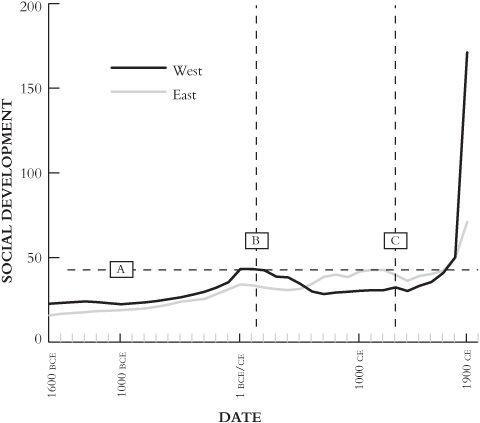
Figure 3.8. Lines through time and space: social development across the three and a half millennia between 1600
BCE
and 1900
CE
, represented on a linear-linear plot. Line A shows a possible threshold around 43 points, which may have blocked the continuing development of the West’s Roman Empire in the first centuries
CE
and China’s Song dynasty around 1100
CE
, before East and West alike broke through it around 1700
CE
. Line B shows a possible connection between declining scores in both East and West in the first centuries
CE,
and line C shows another possible East-West connection starting around 1300
CE
.
Was there some kind of “low-forties threshold” that defeated Rome and Song China? I mentioned in the introduction that, in his book
The Great Divergence
, Kenneth Pomeranz argued that East and West alike ran into an ecological bottleneck in the eighteenth century that should, by rights, have caused their social development to stagnate and decline. Yet they did not, the reason being, Pomeranz suggested, that the British—more through luck than judgment—combined the fruits of plundering the New World with the energy of fossil fuels, blowing away traditional ecological constraints. Could it be that the Romans and Song ran into similar bottlenecks when social development reached the low forties but
failed to open them? If so, maybe the dominant pattern in the last two thousand years of history has been one of long-term waves, with great empires clawing their way up toward the low-forties ceiling then falling back, until something special happened in the eighteenth century.
The second thing that strikes me about
Figure 3.8
is that we can draw vertical lines on it as well as horizontal ones. The obvious place to put a vertical line is in the first century
CE,
when Western and Eastern scores both peaked, even though the Eastern score was well below the Western (34.13 versus 43.22 points). Rather than (or as well as) focusing on the West hitting a low-forties ceiling, perhaps we should be looking for some set of events affecting both ends of the Old World, driving down Roman and Han Chinese social development scores regardless of the levels they had reached.
We could put another vertical line around 1300
CE,
when Eastern and Western scores again followed similar patterns, although this time it was the Western score that was much lower (30.73 as against 42.66 points). The Eastern score had already been sliding for a hundred years, but the Western score now joined it, only for both lines to pick up after 1400 and accelerate even more sharply around 1700. Again, instead of focusing on the scores hitting a low-forties ceiling in the early eighteenth century, perhaps we should look for some global events that started pushing Eastern and Western development along a shared path in the fourteenth century. Perhaps the industrial revolution came first to the West not because of some extraordinary fluke, as Pomeranz concluded, but because East and West were both on track for such a revolution; and then something about the way the West reacted to the events of the fourteenth century gave it a slight but decisive lead in reaching the takeoff point in the eighteenth.
It seems to me that
Figures 3.3
,
3.7
, and
3.8
illuminate a real weakness in both long-term lock-in and short-term accident theories. A few of the theorists focus on the story’s beginning in the agricultural revolution, while the great majority look only at its very end, in the last five hundred years. Because they largely ignore the thousands of years in between, they rarely even try to account for all the spurts of growth, slowdowns, collapses, convergences, changes in leadership, or horizontal ceilings and vertical links that jump out at us when we can see the whole shape of history. That, putting it bluntly, means that neither approach can tell us why the West rules; and that being the case, neither
can hope to answer the question lurking beyond that—what will happen next.
SCROOGE’S QUESTION
At the climax of Charles Dickens’s
A Christmas Carol
, the Ghost of Christmas Yet to Come brings Ebenezer Scrooge to a weed-choked churchyard. Silently, the Ghost points out an untended tombstone. Scrooge knows his name will be on it; he knows that here, alone, unvisited, he will lie forever. “
Are these
the shadows of the things that Will be, or are they shadows of the things that May be, only?” he cries out.
We might well ask the same question about
Figure 3.9
, which takes the rates of increase in Eastern and Western social development in the twentieth century and projects them forward.
*
The Eastern line crosses the Western in 2103. By 2150 the West’s rule is finished, its pomp at one with Nineveh and Tyre.