Windows Server 2008 R2 Unleashed (276 page)
Read Windows Server 2008 R2 Unleashed Online
Authors: Noel Morimoto

capacity planning.
Network Monitor
Network Monitor is a crucial tool that system administrators should have in their arsenal.
Network Monitor, now in its third version, has been overhauled to support the new
networking changes introduced with both Windows Server 2008 R2 and Windows 7.
Network Monitor 3.3 includes several enhancements for capturing network traffic and
parsing the captured data for use in troubleshooting, capacity analysis, and performance
tuning. The next few sections cover using Network Monitor to capture network traffic
between two computers, on a wireless connection, over remote access connections; how
to analyze captured data; and how to parse captured data for analysis. Network Monitor
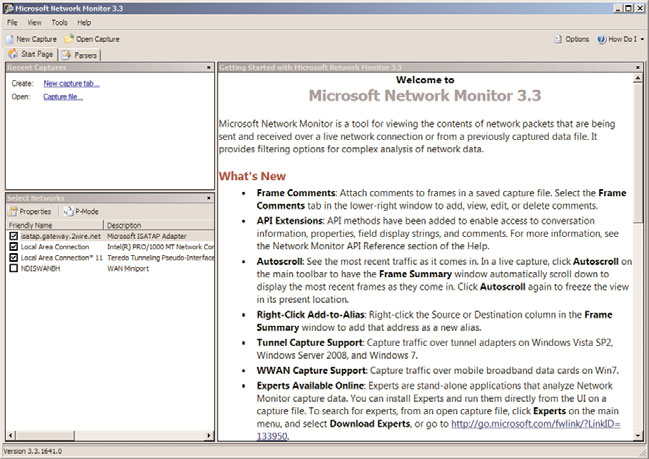
3.3, shown in Figure 34.3, can be downloaded from the System Tools section in the
Microsoft Download Center at www.microsoft.com/downloads/.
Using Capacity-Analysis Tools
1399
34
FIGURE 34.3
The Network Monitor 3.3 interface.
ptg
NOTE
The Network Monitor TechNet blog located at http://blogs.technet.com/netmon con-
tains a wealth of information regarding Network Monitor, capturing, and analyzing data.
NOTE
Network Monitor 3.3 is available in ia64, x64, and x86 versions and can run on
Windows Server 2008 R2, Windows Server 2008, Windows Server 2003, Windows 7,
Windows Vista, and Windows XP systems.
What’s New in Network Monitor 3.3
Network Monitor 3.3 expands on the capabilities of the previous versions of Network
Monitor by including several more features and fixes for issues that were discovered in the
3.x versions. Network Monitor 3.3 is very flexible and can even stop a capture based on an
event log entry in Event Viewer.
The previous versions of Network Monitor included the following:
. An optimized interface that included network conversations and an expandable tree
view of frames for the conversation(s)
. A real-time display and updating of captures
. The ability to capture traffic on multiple network cards simultaneously
1400
CHAPTER 34
Capacity Analysis and Performance Optimization
. The ability to run multiple capture sessions simultaneously
. A script-based protocol parser language
. Support for Windows Server 2008, Windows Vista, Windows XP, and Windows
Server 2003 on 32- or 64-bit platforms
. The ability to capture wireless traffic, scan one or all wireless channels supported by
the network card, and view signal strength and transfer speed of the connection
. The ability to trace traffic inside of a Windows Vista virtual private network (VPN)
tunnel by capturing remote access server (RAS) traffic
. The ability to right-click in the Frame Summary pane and click Add to Filter
. Support for the Windows Update service by periodically checking for updates to the
Network Monitor program
. A redesigned filter toolbar
. A redesigned engine for supporting more protocol schemes
. New public parsers like ip1394, ipcp, PPPoE, and more
Some of the new features in Network Monitor 3.3 include the following:
ptg
. Support for Windows Server 2008 R2, Hyper-V, and Windows 7
. The ability to capture WWAN and tunnel traffic on Window 7 computers
. Support for both IPv4 and IPV6
Using Network Monitor 3.3
Before you can start using the advanced features of Network Monitor, analyzing captured
data, and identifying potential issues and bottlenecks, a basic understanding of Network
Monitor and how it works is necessary.
To capture network traffic, install Network Monitor 3.3 and do the following:
1. Run Network Monitor (Start, All Programs, Microsoft Network Monitor 3.3,
Microsoft Network Monitor 3.3).
2. Click the Create a New Capture Tab link in the left pane.
3. Click the Start button or press F5 to start capturing traffic.
To apply filters to a captured stream of information, do the following:
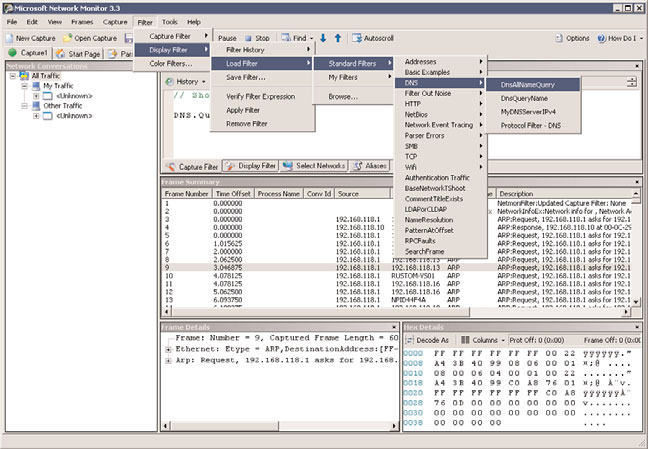
1. With a capture running and the tab selected, as shown in Figure 34.4, click the Filter
menu in the menu bar at the top of the Network Monitor program.
.
To create a capture filter—
Click on Capture Filter, Load Filter, Standard
Filters to select a preconfigured filter that will capture traffic relative to a
specific item such as DNS.
Using Capacity-Analysis Tools
1401
34
FIGURE 34.4
Capturing and Configuring Filters in Network Monitor 3.3.
ptg
.
To create a display filter—
Click on Display Filter, Load Filter, Standard
Filters to select a preconfigured filter that will only display information relative
to a specific item such as DNS from captured data.
.
To create a color filter—
Click on Color Filter, Load Filter, Standard Filters to
apply a color effect to specific items such as DNS.
2. After a filter has been added, it must be applied. Filters can be applied by clicking
the Apply button in the Capture Filter pane, pressing the Ctrl+Enter keys simultane-
ously, or clicking Apply in the Filter menu for the added filter.
3. Apply the filter(s) by clicking the Filter menu at the top of the Network Monitor
program.
. To apply a capture filter, highlight Capture Filter, and click Apply Filter.
. To apply a display filter, highlight Display Filter, and click Apply Filter.
. To add a color filter, click Color Filter, click Add, add an expression (for
example, RDP or 192.168.1.5), and format the font for your preference. Click
OK, and click OK again to apply the filter and close the Color Filter window.
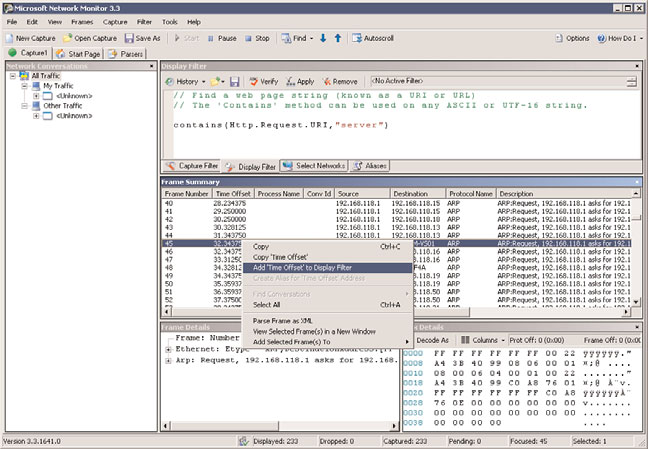
Alternatively, a capture or display filter can be applied by right-clicking on an item in the
Frame Summary pane and selecting Add Cell to Display Filter, as shown in Figure 34.5.
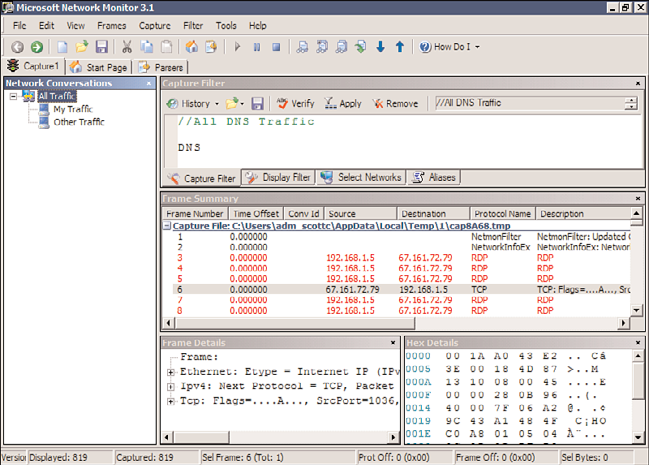
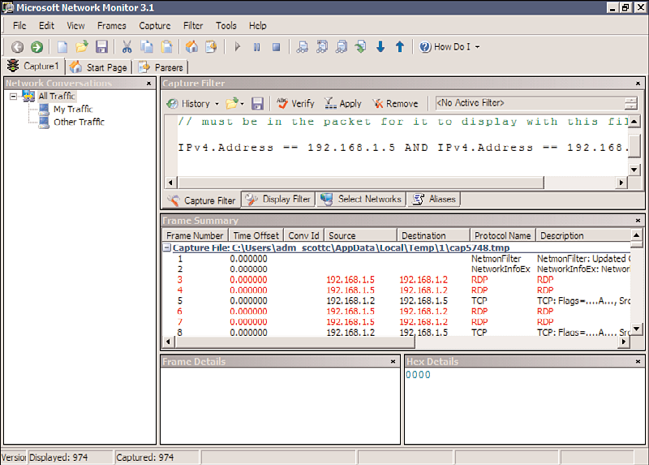
Figure 34.6 shows a sample capture with a DNS capture filter applied and all RDP packets
color-coded in red using a color filter.
1402
CHAPTER 34
Capacity Analysis and Performance Optimization
FIGURE 34.5
Choosing to add a cell to display filter.
ptg
FIGURE 34.6
Sample capture with red highlighted filtered data.
To remove a filter, simply highlight the correct filter type from the Filter menu and select
Remove Filter, click the Remove button in the Capture Filter pane, or press the
Ctrl+Shift+Enter keys simultaneously.
Using Capacity-Analysis Tools
1403
NOTE
Removing a filter does not remove it from the filter list. It just removes it from being
applied.
Capturing Network Traffic Between Computers
As outlined previously, Network Monitor 3.3 includes the ability to capture wireless,
remote, local area network (LAN), and wide area network (WAN) traffic using a remote
agent. In some cases, network administrators want to diagnose or monitor a conversation
between two computers. The steps necessary to monitor traffic between two different
computers are outlined in the following list.
To capture network traffic between two different computers using IPv4 source and destina-
tion addresses, as shown in Figure 34.7, do the following:
34
1. In Network Monitor, click the Create a New Capture Tab button on the left.
2. Click the Filter menu, select Capture Filter, Load Filter, Standard Filters.
3. Select Addresses, and then IPv4 Addresses.
4. Edit the filter to specify the IP addresses that should be filtered in the Capture Filter
window (for example, 192.168.0.100 and Any).
ptg
FIGURE 34.7
Network Monitor capture of network traffic between two IP addresses.
1404
CHAPTER 34
Capacity Analysis and Performance Optimization
5. Click the Apply button in the Capture Filter pane.