Windows Server 2008 R2 Unleashed (279 page)
Read Windows Server 2008 R2 Unleashed Online
Authors: Noel Morimoto

Operations Manager 2007 R2 with Windows Server 2008 R2.”
Third-Party Toolset
Without a doubt, many third-party utilities are excellent for capacity-analysis and perfor-
mance monitoring purposes. Most of them provide additional functionality not found in
Windows Server 2008 R2’s Performance Monitor and other tools, but they have a cost and
might have special requirements for deployment and integration into the organization’s
network. You might want to evaluate some third-party utilities to get a more thorough
understanding of how they might offer more features than Microsoft solutions. Generally
speaking, these utilities enhance the functionality that’s inherent to Microsoft monitoring
solutions, such as scheduling, an enhanced level of reporting functionality, superior
ptg
storage capabilities, the ability to monitor non-Windows systems, or algorithms for future
trend analysis. Some of these third-party tools are listed in Table 34.2.
TABLE 34.2
Third-Party Capacity-Planning and Monitoring Tools
Utility Name
Company
Website
AppManager
NetIQ
http://www.netiq.com/products/am/default.asp
Suite
Corporation
BMC
BMC
www.bmc.com/
Performance
Software
Manager
HP BTO
HP
https://h10078.www1.hp.com/cda/hpms/display/main/
Software
hpms_home.jsp?zn=bto&cp=1_4011_100__
Robomon/
Heroix
www.robomon.com/
Longitude
NSM
CA
www.ca.com/
Although it might be true that most third-party capacity-analysis and performance moni-
toring products might add more or different functionality to your capacity-analysis and
performance monitoring procedures or goals, there are still pros and cons to using them
over the free tools included with Windows Server 2008 R2 or other solutions available
Monitoring System Performance
1415
from Microsoft. The key is to decide what you need to adequately and efficiently perform
capacity-analysis and performance monitoring procedures in your environment. Taking
the time to research and experiment with the different solutions available today, from
Microsoft and others, will only benefit you in making an informed decision for managing
your Windows Server 2008 R2 environment.
Capacity analysis is not about how much information you can collect; it is about collect-
ing the appropriate system health indicators and the right amount of information.
Without a doubt, you can capture and monitor an overwhelming amount of information
from performance counters. There are more than 1,000 counters, so you’ll want to care-
fully choose what to monitor. Otherwise, you might collect so much information that the
data will be hard to manage and difficult to decipher. Keep in mind that more is not
34
necessarily better with regard to capacity analysis. This process is more about efficiency.
Therefore, you need to tailor your capacity-analysis monitoring as accurately as possible to
how the server is configured.
Every Windows Server 2008 R2 server has a common set of resources that can affect perfor-
mance, reliability, stability, and availability. For this reason, it’s important that you monitor
this common set of resources, namely CPU, memory, disk, and network utilization.
ptg
In addition to the common set of resources, the functions that the Windows Server 2008
R2 server performs can influence what you should consider monitoring. So, for example,
you would monitor certain aspects of system performance on file servers differently than
you would for a domain controller running on Windows Server 2008 R2 AD DS. There are
many functional roles (such as file and print sharing, application sharing, database func-
tions, web server duties, domain controller roles, and more) that Windows Server 2008 R2
can perform, and it is important to understand all those roles that pertain to each server
system. By identifying these functions and monitoring them along with the common set
of resources, you gain much greater control and understanding of the system.
The following sections go more in depth on what specific items you should monitor for
the different components that constitute the common set of resources. It’s important to
realize, though, that there are several other items that should be considered regarding
monitoring in addition to the ones described in this chapter. You should consider the
following material a baseline of the minimum number of things to begin your capacity-
analysis and performance-optimization procedures.
Key Elements to Monitor for Bottlenecks
As mentioned, four resources compose the common set of resources: memory and pagefile
usage, processor, disk subsystem, and network subsystem. They are also the most common
contributors to performance bottlenecks. A bottleneck can be defined in two ways. The
most common perception of a bottleneck is that it is the slowest part of your system. It
can either be hardware or software, but generally speaking, hardware is usually faster than
software. When a resource is overburdened or just not equipped to handle higher work-
load capacities, the system might experience a slowdown in performance. For any system,
1416
CHAPTER 34
Capacity Analysis and Performance Optimization
the slowest component of the system is, by definition, considered the bottleneck. For
example, a web server might be equipped with ample RAM, disk space, and a high-speed
network interface card (NIC), but if the disk subsystem has older drives that are relatively
slow, the web server might not be able to effectively handle requests. The bottleneck (that
is, the antiquated disk subsystem) can drag the other resources down.
A less common, but equally important, form of bottleneck is one where a system has
significantly more RAM, processors, or other system resources than the application
requires. In these cases, the system creates extremely large pagefiles, has to manage very
large sets of disk or memory sets, yet never uses the resources. When an application needs
to access memory, processors, or disks, the system might be busy managing the idle
resource, thus creating an unnecessary bottleneck caused by having too many resources
allocated to a system. Thus, performance optimization means not having too few
resources, but also means not having too many resources allocated to a system.
Monitoring System Memory and Pagefile Usage
Available system memory is usually the most common source for performance problems
on a system. The reason is simply that incorrect amounts of memory are usually installed
on a Windows Server 2008 R2 system. Windows Server 2008 R2 tends to consume a lot of
memory. Fortunately, the easiest and most economical way to resolve the performance
ptg
issue is to configure the system with additional memory. This can significantly boost
performance and upgrade reliability.
There are many significant counters in the memory object that could help determine
system memory requirements. Most network environments shouldn’t need to consistently
monitor every single counter to get accurate representations of performance. For long-
term monitoring, two very important counters can give you a fairly accurate picture of
memory pressure: Page Faults/sec and Pages/sec memory. These two memory counters
alone can indicate whether the system is properly configured and experiencing memory
pressure. Table 34.3 outlines the counters necessary to monitor memory and pagefile
usage, along with a description of each.
TABLE 34.3
Important Counters and Descriptions Related to Memory Behavior
Object
Counter
Description
Memory
Committed
Monitors how much memory (in bytes) has been allocated by the
Bytes
processes. As this number increases above available RAM so does
the size of the pagefile as paging has increased.
Memory
Pages/sec
Displays the amount of pages that are read from or written to the
disk.
Memory
Pages
Displays virtual memory pages written to the pagefile per second.
Output/sec
Monitor this counter to identify paging as a bottleneck.
Memory
Page
Reports both soft and hard faults.
Faults/sec
Monitoring System Performance
1417
TABLE 34.3
Important Counters and Descriptions Related to Memory Behavior
Object
Counter
Description
Process
Working Set,
Displays the amount of virtual memory that is actually in use.
_Total
Paging
%pagefile in
Reports the percentage of the paging file that is actually in use. This
file
use
counter is used to determine if the Windows pagefile is a potential
bottleneck. If this counter remains above 50% or 75% consistently,
consider increasing the pagefile size or moving the pagefile to a differ-
ent disk.
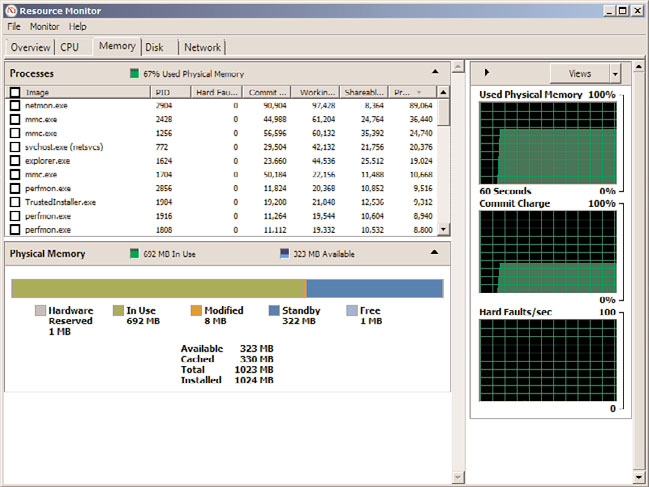
By default, the Memory tab in Resource Monitor, shown in Figure 34.14, provides a good
high-level view of current memory activity. For more advanced monitoring of memory
34
and pagefile activity, use the Performance Monitor snap-in.
ptg
FIGURE 34.14
Memory section of the Resource Monitor.
Systems experience page faults when a process requires code or data that it can’t find in
its working set. A working set is the amount of memory that is committed to a particular
process. When this happens, the process has to retrieve the code or data in another part
of physical memory (referred to as a soft fault) or, in the worst case, has to retrieve it
from the disk subsystem (a hard fault). Systems today can handle a large number of soft
faults without significant performance hits. However, because hard faults require disk
1418
CHAPTER 34
Capacity Analysis and Performance Optimization
subsystem access, they can cause the process to wait significantly, which can drag perfor-
mance to a crawl. The difference between memory and disk subsystem access speeds is
exponential even with the fastest hard drives available. The Memory section of the
Resource Monitor in Performance Monitor includes columns that display working sets
and hard faults by default.
The Page Faults/sec counter reports both soft and hard faults. It’s not uncommon to see
this counter displaying rather large numbers. Depending on the workload placed on the
system, this counter can display several hundred faults per second. When it gets beyond
several hundred page faults per second for long durations, you should begin checking
other memory counters to identify whether a bottleneck exists.
Probably the most important memory counter is Pages/sec. It reveals the number of pages
read from or written to disk and is, therefore, a direct representation of the number of
hard page faults the system is experiencing. Microsoft recommends upgrading the amount
of memory in systems that are seeing Pages/sec values consistently averaging above 5
pages per second. In actuality, you’ll begin noticing slower performance when this value is
consistently higher than 20. So, it’s important to carefully watch this counter as it nudges
higher than 10 pages per second.
ptg
NOTE
The Pages/sec counter is also particularly useful in determining whether a system is
thrashing. Thrashing is a term used to describe systems experiencing more than 100
pages per second. Thrashing should never be allowed to occur on Windows Server
2008 R2 systems because the reliance on the disk subsystem to resolve memory
faults greatly affects how efficiently the system can sustain workloads.
System memory (RAM) is limited in size and Windows supplements the use of RAM with
virtual memory, which is not as limited. Windows will begin paging to disk when all RAM
is being consumed, which, in turn, frees RAM for new applications and processes. Virtual
memory resides in the pagefile.sys file, which is usually located in the root of the system
drive. Each disk can contain a pagefile. The location and size of the pagefile is configured
under the Virtual Memory section, shown in Figure 34.15.