Windows Server 2008 R2 Unleashed (277 page)
Read Windows Server 2008 R2 Unleashed Online
Authors: Noel Morimoto

6. Click the Start button on the main Network Monitor menu bar or press the F5 key to
start the capture.
Parsing Captured Network Traffic Data
Parsing captured data allows the information to be converted into a format that is more
legible to the naked eye. Parsing captured data makes analysis of the captured data
easier—in fact, it’s almost essential. The Network Monitor parsing engine was completely
rewritten to support the new functionality of Network Monitor 3.3.
To modify parsing of captured data in Network Monitor 3.3, do the following:
1. With a capture running or loaded from a saved file, select the Parsers tab in Network
Monitor, as shown in Figure 34.8.
ptg
FIGURE 34.8
Parsers tab of Network Monitor 3.3.
2. Expand the appropriate parsing category and double-click on the desired parser to
load the parser code into the editor. Parsers use Network Monitor Parser Language
(NPL), a simple-to-use language. Help for NPL is included in the Network Monitor
3.3 Help file.
Using Capacity-Analysis Tools
1405
Windows Performance Monitor
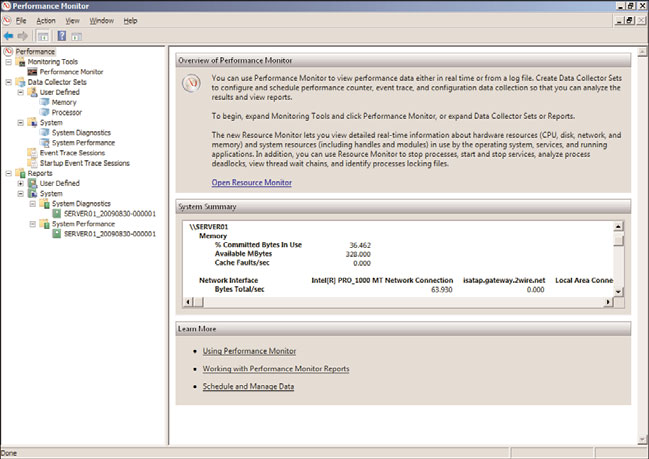
The Performance Monitor in Windows Server 2008 R2, shown in Figure 34.9, has been
modified since Windows Server 2008 as it no longer includes the Reliability Monitor snap-
in. The Performance Monitor is composed of three main components: monitoring tools
such as Performance Monitor, Data Collector Sets, and a reporting component. The
Performance Monitor can be launched from within the Windows Server 2008 R2 Server
Manager or from the Start, All Programs, Administrative Tools menu.
34
ptg
FIGURE 34.9
Performance Monitor in Windows 2008 R2.
Using Performance Monitor, administrators can identify bottlenecks and pinpoint resource
issues with applications, processes, or hardware. Monitoring these items can help identify
and resolve issues, plan for capacity changes, and help establish baselines that can be used
for analysis in the future. Upon launching the Performance Monitor, a summary of system
performance is displayed, showing current memory, disk, processor, and network loads.
Performance Monitor
Many IT professionals rely on the Performance Monitor because it is bundled with the
operating system, and it allows you to capture and monitor every measurable system
object within Windows Server 2008 R2. Using the tool involves little effort to become
familiar with it. You can find and start the Performance Monitor from within the
1406
CHAPTER 34
Capacity Analysis and Performance Optimization
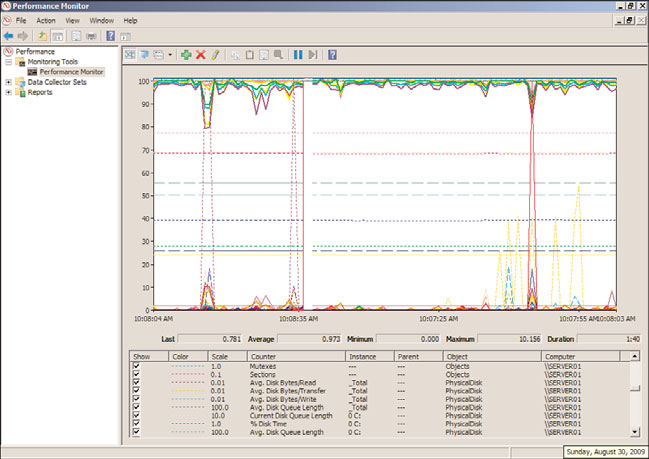
Performance Monitor program under Monitoring Tools in the console view. The
Performance Monitor, shown in Figure 34.10, is by far the best utility provided in the
operating system for capacity-analysis purposes. With this utility, you can analyze data
from virtually all aspects of the system both in real time and historically. This data analy-
sis can be viewed through charts, reports, and logs. The log format can be stored for use
later so that you can scrutinize data from succinct periods of time.
ptg
FIGURE 34.10
Performance Monitor expanded Data Collector Sets.
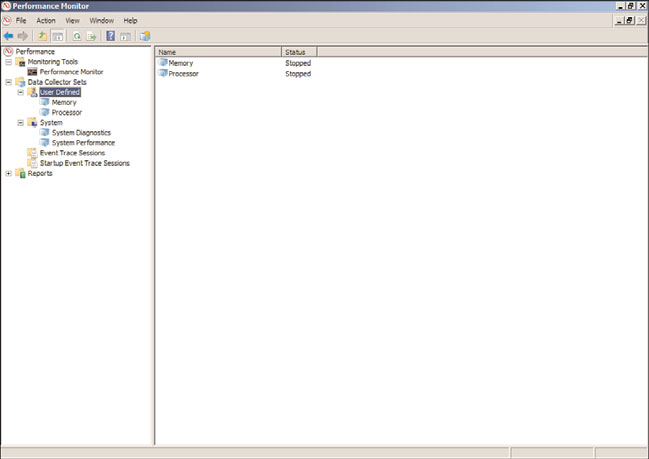
Data Collector Sets
As mentioned previously, Data Collector Sets are a collective grouping of items to be
monitored. You can use one of the predefined sets or create your own to group together
items that you want to monitor. Data Collector Sets are useful for several reasons. First,
data collectors can be a common theme or a mix of items. For example, you could have
one Data Collector Set that monitors only memory or a Data Collector Set that contains a
myriad of items such as memory, disk usage, processor time, and more. Data Collector Sets
can also be scheduled to run when needed. The Data Collector Sets section of the
Performance Monitor is shown in Figure 34.11.
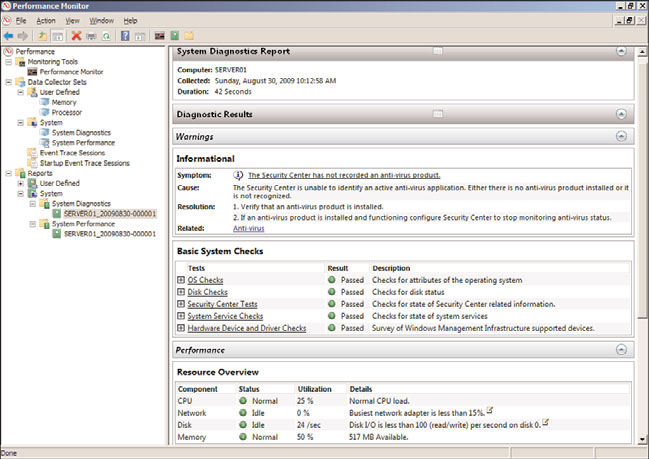
Reports
As previously discussed, the Performance Monitor includes an updated reporting mecha-
nism and several template performance and diagnostic reports for use. In addition, reports
can also be created manually or generated from Data Collector Sets. Three system reports
are included for diagnosing and assessing system performance: LAN Diagnostics, System
Diagnostics, and System Performance. The following steps outline the process to view a
System Diagnostics report. Figure 34.12 shows a sample System Diagnostics report.
Using Capacity-Analysis Tools
1407
34
FIGURE 34.11
Data Collector Sets in Performance Monitor.
ptg
FIGURE 34.12
System Diagnostics report in Performance Monitor.
1408
CHAPTER 34
Capacity Analysis and Performance Optimization
To create and view reports in Performance Monitor, do the following:
1. Expand Data Collector Sets and System in the console tree of Performance Monitor.
2. Right-click on either the System Diagnostics or System Performance sets and select
Start. Windows will begin collecting data for the report.
3. When you have collected enough data, right-click the collection set again, and
select Stop.
4. Expand Reports, System and click the collection set you chose earlier. Double-click
the report listed under that performance set.
5. The report will be compiled and displayed, as in Figure 34.12.
Other Microsoft Assessment and Planning Tools
Several other products and tools are available from Microsoft to assist with proper capacity
analysis and performance monitoring. Some of these tools are available for purchase sepa-
rately or can be downloaded for free. Selecting the right tool or product depends on the
goal you are trying to accomplish. For example, the Windows System Resource Manager
(WSRM) would be used if you want to implement thresholds for the amount of resources
an application or process is allowed to consume, and System Center Operations Manager
might be deployed if you want to be notified when critical processes behave abnormally
ptg
on production servers.
Discussing each of these tools in depth is beyond the scope of this book; however, a basic
understanding and overview of their purposes will help you make an informed decision
when selecting the right technologies for analyzing system resources, availability, and
performance.
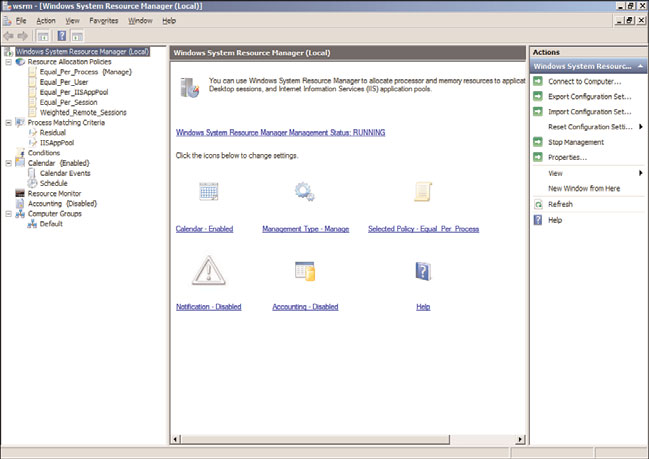
Windows System Resource Manager
Windows System Resource Manager is included in the feature set of Windows Server 2008
R2 and provides an interface that allows you to configure how processor and memory
resources are allocated among applications, services, and processes. Having the ability to
control these items at such a granular level can help ensure system stability, thus improv-
ing system availability, improving the user experience. Assigning thresholds to services,
applications, and processes can prevent issues like high CPU consumption. System
Resource Manager is installed as a feature in Server Manager. System Resource Manager
can manage multiple items on the local system and remote computers (if Remote Desktop
Services is installed). The System Resource Manager interface is shown in Figure 34.13.
To install System Resource Manager, do the following:
1. Launch Server Manager by choosing it in the Administrative Tools folder.
2. Click Features in the Scope pane on the left.
3. Click Add Features in the central Details pane; the Select Features window opens.
4. Scroll down and select Windows System Resource Manager.
5. If it isn’t already installed, a notification window opens stating that the Windows
Internal Database feature must also be installed. Click the Add Required Features
button to accept the addition of the feature.
Using Capacity-Analysis Tools
1409
34
FIGURE 34.13
Windows System Resource Manager.
ptg
6. Click Next.
7. Click Install to install the Windows System Resource Manager and required
components.
8. Click Close when the installation completes.
NOTE
A warning appears in Server Manager if the Windows System Resource Manager service
is not started. This service must be running to use Windows System Resource Manager.
After WSRM is installed, you can start fine-tuning the Windows Server 2008 R2 server’s
processes, services, applications, and other items to ensure CPU cycles and memory usage
are allocated appropriately. WSRM provides administrators with a means of adjusting the
system to meet the demands of those accessing it. WSRM can allocate CPU time and
memory usage through the use of the included resource allocation policies or a
customized one. Observed system usage and data obtained from tools like Performance