X and the City: Modeling Aspects of Urban Life (20 page)
Read X and the City: Modeling Aspects of Urban Life Online
Authors: John A. Adam


after a little reduction. We take
T
W
= 20s and
a
= 10
−3
km/s
2
≈ 1.3 × 10
4
km/hr
2
in what follows. Then equation (7.1) takes the form
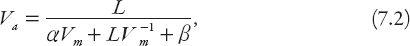
where
α
= 7.7 × 10
−5
,
β
= 5.6 × 10
−3
.
It is interesting to note that on the basis of formula (7.2),
V
a
possesses a shallow maximum occurring at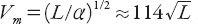 for the constants chosen here. For a station separation
L
= 0.5 km this corresponds to
V
m
≈ 80 km/hr. It can be seen from
Figure 7.2
that for
L
= 1 km the maximum average speed attainable is only about 40 km/hr regardless of maximum speed. For a stop spacing of 0.25 km the maximum is less than 20 km/hr. In these cases the vehicle does not have enough time to reach its maximum speed and merely accelerates to the midpoint and then decelerates.
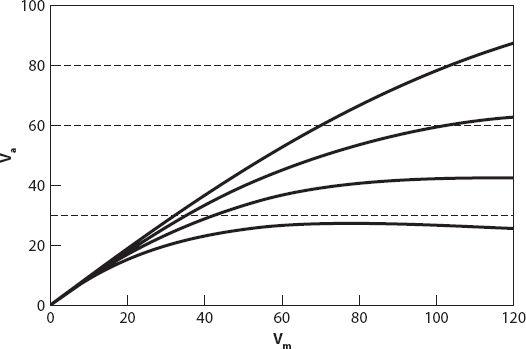
Figure 7.2. Average speed vs. maximum speed for different values of station spacing
L
= 5 km, 2 km, 1 km, 0.5 km.
The next phase of the calculation is to include passenger “walk and wait” times, the latter referring to the wait for the arrival of the train or bus. Furthermore, a trip length is now assumed. We shall adopt 80 m/min or 4.8 km/hr for the average walking speed, the average passenger wait time as 5 minutes, and an estimate of 8 km for the average (UK) trip length [
14
]. The number of stops beyond the origin is 8/
L
(if this is an integer), as is the number of in-station wait times
T
W
. For small values of
L
(less than 0.25 km, for example) the model is impractical, but we shall nevertheless treat
L
(and the number of stations) as a continuous variable. The average speed is now

Graphs of
V
a
(
L
) for
V
m
= 30 km/hr and 80 km/hr are shown in
Figures 7.3a
and
7.3b
, for comparison with the graph for the in-vehicle average speed without the passenger walk-and-wait times (the above expression without the last two terms in the denominator). The lower speed for
V
m
is representative of a bus, given the typical stops necessary at crosswalks (pedestrian crossings) and traffic lights. The higher speed is more typical of light rail, monorail, or possibly priority bus lanes, which would ensure higher average speed. From the
figure it is seen that for the bus the optimum spacing
L
between stations (corresponding to the peak average speed) is about 0.5 km. For the higher speed, the optimum spacing is closer to 0.75 km.
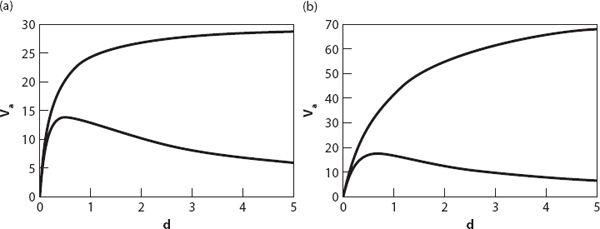
Figure 7.3. (a) Average speed vs. stop separation (in km) for maximum speeds of 30 km/hr for in-vehicle with stops (upper curve) and with walk and wait times included (lower curve). (b) Average speed vs. stop separation (in km) for maximum speeds of 80 km/hr for in-vehicle with stops (upper curve) and also with walk and wait times included (lower curve). The generic distance
d
in
Figures 7.3
–
7.5
represents the spacing
L
between stops.
Note what little difference the increase in maximum speed makes to the maximum average speed. These average speeds are probably at best comparable to the average speed for cars in rush hour periods, since the latter will not have to keep stopping to let passengers on or off. This model suggests that overall trip times using public transport will generally be higher than for cars during the same peak times.
=
L
v
: AVERAGE TRIP LENGTH IN THE CITY
Consider first an eastbound trip consisting of
N
stops, numbered from
n
= 0 to
N
− 1. The total number of such trips from 0 is
N
− 1, from 1 is
N
− 2, etc. so summing over all values of
n
we find that the total number of eastbound trips is the well-known result
The sum of all the trips from the
m
th stop eastward (0 ≤
m
≤
N
− 1)can be found by replacing
N
above by
N
−
m
, that is,
If the stations are a distance
L
apart, then the sum of
all
trip distances from
all
stops is
L
times the sum of the above expression over all possible values of
m
, that is,

Exercise:
establish the result (7.4).
For trips on a rectangular grid containing
M
stops on the
N-S
corridors, the total length of eastbound trips in any one row is
M
times the result (7.4) above, and the total length over all rows requires multiplication by
M
once more. Multiplying this by two for the westbound trips, the total length of eastbound and westbound trips is