Read X and the City: Modeling Aspects of Urban Life Online
Authors: John A. Adam
X and the City: Modeling Aspects of Urban Life (28 page)

Increasing volume of traffic has obvious consequences. It generally causes a reduction in the mean speed of vehicles and also can affect the mean spacing between them. If this mean spacing is measured in terms of time rather than distance, as introduced at the end of
Chapter 8
, it is called a
headway
.
It’s time for a little integration practice; let’s combine it with some useful definitions. This will enable us to derive in a straightforward manner some results of interest in studies of pedestrian delays and minor-road delays to vehicles [
19
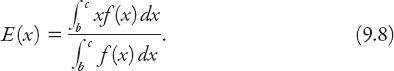
]. As is standard practice in probability theory, we define the expectation
E
(
x
) for a continuous random variable taking on values in (
b
,
c
) with
probability density function
(p.d.f.)
f
(
x
); it is

Note that by definition of a p.d.f., the integral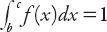 , so that for future reference we can write the expectation value as
The expectation can be thought of as a mean value of the random variable. We shall consider the above displaced exponential distribution, which gives the distribution of lengths of intervals ≥
a
between vehicles (headways). We can therefore calculate the mean headway time for all vehicles as

Obviously this reduces to
λ
−1
when
a
= 0, as it should (recall that
λ
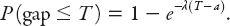
is just the mean number of vehicles arriving in unit time). There are several other related properties of this distribution that are of interest to traffic engineers. The proportion of intervals in the interval (
a
,
t
) is
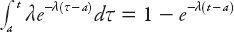
The proportion of intervals >
t
seconds is therefore
e
−
λ
(
t
−
a
)
. The proportion of
time
occupied by intervals ≤
t
seconds is the weighted average
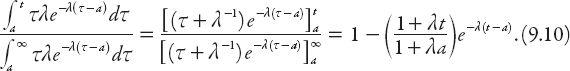
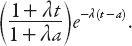
Not surprisingly, the proportion of time occupied by intervals >
t
seconds is
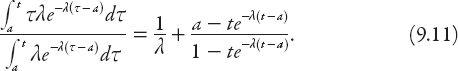
Finally, the mean headway time for all intervals ≤
t
seconds is given by the expression
The corresponding result for all intervals greater than
t
(>
a
) seconds is
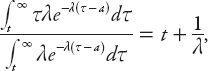
which is a result (not surprisingly) independent of
a
.
Exercise:
Practice your integration by verifying equations (9.9)–(9.11).
Negative exponential distributions are sometimes considered even more important than the Poisson distribution in traffic flow, since they provide information about headways. Realistically, the hypothesis of random traffic distributions best describes situations where the traffic flow is light and vehicles can pass freely. Then the vehicles can be considered to be approximately randomly distributed along a road. In practice, however, as drivers well know, passing can be partially restricted by other vehicles in the passing lane(s), bends in the road, brows of hills, and so on. Some drivers who catch up to cars moving slightly less fast are content to stay behind them (though I find it a little frustrating), so bunching of vehicles is very common. Under these circumstances other distributions are more relevant to understanding traffic flow: for example the intervals between the “endpoints” of such bunches may follow a negative exponential or other distribution.
TRAFFIC IN THE CITY