Build Your Own ASP.NET 3.5 Website Using C# & VB (39 page)
Read Build Your Own ASP.NET 3.5 Website Using C# & VB Online
Authors: Cristian Darie,Zak Ruvalcaba,Wyatt Barnett
Tags: #C♯ (Computer program language), #Active server pages, #Programming Languages, #C#, #Web Page Design, #Computers, #Web site development, #internet programming, #General, #C? (Computer program language), #Internet, #Visual BASIC, #Microsoft Visual BASIC, #Application Development, #Microsoft .NET Framework

be your only choice. As such, it’s important that you know how to use them.
Licensed to [email protected]
212
Build Your Own ASP.NET 3.5 Web Site Using C# & VB
Debugging and Error Handling
Your work with Dorknozzle for this chapter is over, but now that we’ve started to
create a real-world application, it’s time to consider the real-world problems that
might occur as we’re developing that application. A constant truth in the life of any
programmer is that programming mistakes do happen, and they happen no matter
how experienced the programmer is. For this reason, it’s beneficial to know what
you can do when you encounter an error, and to learn how ASP.NET and Visual
Web Developer can help you analyze and debug your code.
Debugging with Visual Web Developer
Create a new web form in Visual Web Developer that uses a code-behind file in
your
C:\LearningASP\VB
or
C:\LearningASP\CS
folder, and call it
ErrorTest.aspx
. Then add the code below to the Page_Load method (remember, if you’re using VB, to
double-click the page in design mode to generate the method) in the code-behind
file:
Visual Basic
LearningASP\VB\ErrorTest_01.aspx.vb
(excerpt)
Protected Sub Page_Load(ByVal sender As Object,
➥ ByVal e As System.EventArgs) Handles Me.Load
Dim a(10) As Integer
Dim i As Integer
For i = 1 To 11
a(i) = i
Next
End Sub
C#
LearningASP\CS\ErrorTest_01.aspx.cs
(excerpt)
protected void Page_Load(object sender, EventArgs e)
{
int[] a = new int[10];
int i;
for (i = 0; i < 11; i++)
{
a[i] = i;
}
}
Licensed to [email protected]

Building Web Applications
213
The code above creates an array of ten elements, then uses a For loop to assign
values to them. The problem is that it doesn’t stop at the tenth element: it also tries
to assign a value to the 11th element, which doesn’t exist.
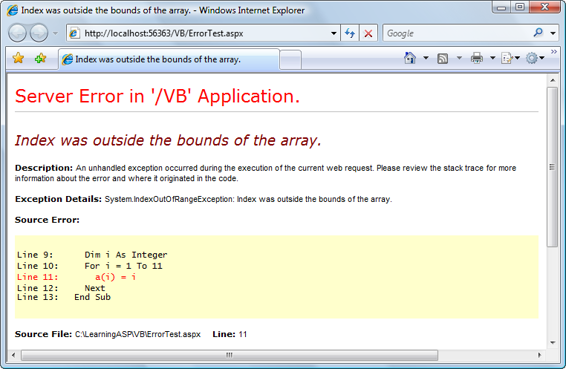
If you execute the page without debugging (using the
CTRL+F5
shortcut), the page
will generate an error in your web browser
, as shown in Figure 5.35.
Figure 5.35. Viewing the unhelpful error message
You can obtain more details by executing the project in debug mode (by pressing
F5
in Visual Web Developer).
Licensed to [email protected]

214
Build Your Own ASP.NET 3.5 Web Site Using C# & VB
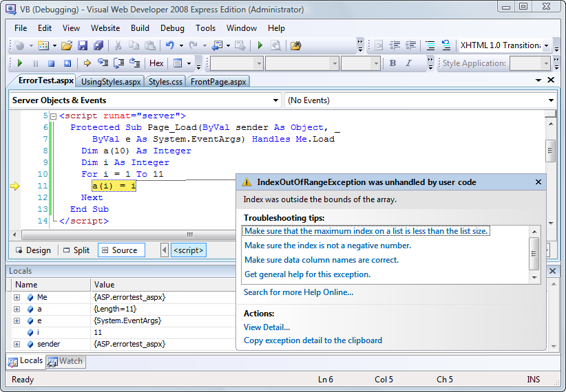
Figure 5.36. Debugging a run-time error
Executing the page once again—this time, with debugging enabled—takes you
straight to the error in Visual Web Developer
, as Figure 5.36
illustrates. This interface tells you that the code has thrown an
exception
of type
IndexOutOfRangeException. In .NET, exceptions are the standard means by which
errors are generated and propagated. An exception is a .NET class (in this case, the
IndexOutOfRangeException class) that contains the details of an error. As you’ll
see a little later, you can
catch
the error in your code using the Try-Catch-Finally
construct. If the error isn’t caught and handled, as in this case, it’s finally caught
by the ASP.NET runtime, which generates an error message.
In Figure 5.36
, the debugger has paused execution at the moment the exception was raised. Let’s see what your options are at this moment. One very useful window is
the Watch window, which appears by default when your application is being debugged. If it’s not displayed, you can open it by accessing
Debug
>
Windows
>
Watch
. You can type the names of the objects in your code into the Watch window; in response, it will display their values and types. Try typing
a(5)
(or
a[5]
if you’re using C#) into the W
atch window; you should see a display like the one in Fig-
Licensed to [email protected]


Building Web Applications
215
Figure 5.37. Inspecting values using the Watch window
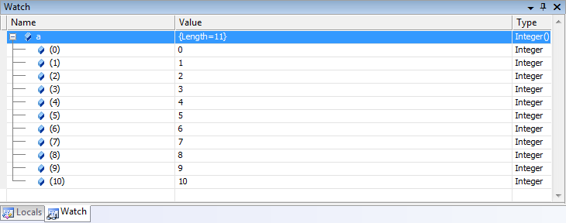
You could even type just
a
, then explore its members via the display shown in
Figure 5.38. The Watch window showing the contents of an array
Arrays and VB
This example reveals an interesting aspect of this array. The Watch window reports
that the array’s length is 11, yet we defined it as a(10). In all .NET languages,
arrays are zero-based, which means that the first element of an array is a(0), the
second is a(1), and so on. So an array called a that had ten elements would have
as its first element a(0), and a(9) as its last.
However, VB offers extra assistance for developers who are experienced with pre.NET versions of the language (which used one-based arrays in which the first element would have been a(1), and the last would have been a(10)): it adds an
element for you. In other words, if you declare an array of ten elements in VB,
you’ll get an array of 11 elements.
C# has always had zero-based arrays, so an array defined as a[10] will have ten
elements.
In more complex scenarios, if you enter the name of an object, the Watch window
will let you explore its members as we just saw.
Licensed to [email protected]

216
Build Your Own ASP.NET 3.5 Web Site Using C# & VB
If you switch to the Locals window (
Debug
>
Windows
>
Locals
) shown in Figure 5.39
, you can see the variables or objects that are visible from the line of code at which
the execution was paused.
Figure 5.39. The Locals window
Another nice feature of Visual Web Developer is that when you hover your cursor
over a variable, the editing window shows you at-a-glance information about that
variable.
Sometimes, you’ll want to debug your application even if it doesn’t generate an
exception. For example, you may find that your code isn’t generating the output
you expected. In such cases, it makes sense to execute pieces of code line by line,
and see in detail what happens at each step.
The most common way to get started with this kind of debugging is to set a
break-
point
in the code. In Visual Web Developer, we do this by clicking on the gray bar
on the left-hand side of the editing window. When we click there, a red bullet appears, and the line is highlighted with red to indicate that it’
s a breakpoint, as Fig-
Once the breakpoint is set, we execute the code. When the execution pointer reaches
the line you selected, execution of the page will be paused and Visual Web Developer
will open your page in debug mode. In debug mode, you can perform a number of
tasks:
■ View the values of your variables or objects.
