The Bell Curve: Intelligence and Class Structure in American Life (100 page)
Read The Bell Curve: Intelligence and Class Structure in American Life Online
Authors: Richard J. Herrnstein,Charles A. Murray
Tags: #History, #Science, #General, #Psychology, #Sociology, #Genetics & Genomics, #Life Sciences, #Social Science, #Educational Psychology, #Intelligence Levels - United States, #Nature and Nurture, #United States, #Education, #Political Science, #Intelligence Levels - Social Aspects - United States, #Intellect, #Intelligence Levels

For the ASVAB, 64 percent of the variance among the ten subtest scores is accounted for by a single factor,
g.
A second factor accounts for another 13 percent. With three inferred factors, 82 percent of the variance is accounted for.
6
The intercorrelations indicate that people do vary importantly in some single, underlying trait and that those variations affect how they do on every test. Nor is the predominance of
g
a fortuitous result of the particular subtests in ASVAB. The air force’s aptitude test for prospective officers, the AFOQT (Air Force Officer Qualifying Test) similarly has
g
as its major source of individual variation.
7
Indeed, all broad-gauged test batteries of cognitive ability have
g
as their major source of variation among the scores people get.
8
The naive theory assumes that when scores on two subtests are correlated, it is because of overlapping content. But it is impossible to make sense of the varying correlations between the subtests in terms of overlapping content. Consider again the correlation between Arithmetic Reasoning and Mathematical Knowledge, which is the highest of all. It may seem to rest simply on a knowledge of mathematics and arithmetic. However, the score on Numerical Operations is less correlated with either of those two tests than the two are with each other. Content provides no clue as to why. Arithmetic Reasoning has only word problems on it; Mathematical Knowledge applies the basic methods of algebra and geometry; and Numerical Operations is an arithmetic test. Why are scores on algebra and geometry more similar to those on word problems than to those on arithmetic? Such variations in the correlations between the subtests arise, in fact, less from common content than from how much they draw on the underlying ability we call
g.
The varying correlations between the subtests preclude explaining
g
away as, for example, simply a matter of test-taking ability or test-taking experience, which should affect all tests more or less equally. We try to make some of these ideas visible in the figure below.
The relation of the ASVAB subtests to each other and to g
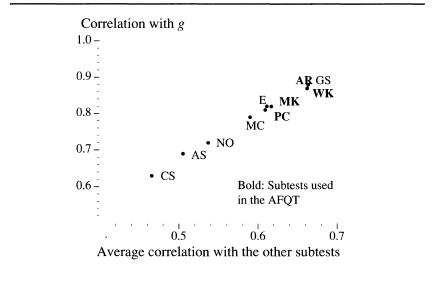
For each subtest on ASVAB, we averaged the nine correlations with each of the other subtests, and that average correlation defines the horizontal axis. The vertical axis is a measure, for each subtest, of the correlation between the score and
g.
9
The two-letter codes identify the subtests. At the top is General Science (GS), closely followed by Word Knowledge (WK), and Arithmetical Reasoning (AR), for which the scores are highly correlated with
g
and have the highest average correlations with all the subtests. Another three subtests—Mathematics Knowledge (MK), Paragraph Comprehension (PC), and Electronics Information (EI)—are just slightly below the top cluster in both respects. At the bottom are Coding Speed (CS), Automobile/Shop Information (AS), Numerical Operations (NO), and Mechanical Comprehension (MC), subtests that correlate, on the average, the least with other subtests and are also the least correlated with
g
(although still substantially correlated in their own right). The bottom group includes the two speeded subtests, CS and NO, thereby refuting another common misunderstanding about
g,
which is that it refers to mental speed and little more. Virtually without exception, the more dependent a subtest score is on
g,
the higher is its average correlation with the other subtests. This is the pattern that betrays what
g
means—a broad mental capacity that permeates performance on anything that challenges people cognitively. A rough rule of thumb is that items or tests that require mental complexity draw more on
g
than items that do not—the difference, for example, between simply repeating a string of numbers after hearing them once, which does not much test
g,
and repeating them in reverse order, which does.
10
The four subtests used in the 1989 scoring version of the AFQT (the one used throughout the text) and their
g
loadings are Word Knowledge (.87), Paragraph Comprehension (.81), Arithmetic Reasoning (.87), and Mathematics Knowledge (.82).
11
The AFQT is thus one of the most highly
g-
loaded tests in use. By way of comparison, the factor loadings for the eleven subtests of the Wechsler Adult Intelligence Scale (WAIS) range from .63 to .83, with a median of .69.
12
Whereas the first factor, g, accounts for over 70 percent of the variance in the AFQT, it accounts for only 53 percent in the WAIS.
Our second approach to the question, Is the AFQT an IQ test? is to ask how the AFQT correlates with other well-known standardized mental tests (see the table below). We can dc so by making use of the high school transcript survey conducted by the NLSY in 1979. In addition to gathering information about grades, the survey picked up any other IQ test that the student had taken within the school system. The data usually included both the test score and the percentile rank, based on national norms. In accordance with the recommendation of the NLSY
User’s Manual,
we use percentiles throughout.
13
| Correlations of the AFQT with Other IQ Tests in The NLSY | ||
|---|---|---|
| | Sample | Correlation with the AFQT |
| California Test of Mental Maturity | 356 | .81 |
| Coop School and College Ability Test | 121 | .90 |
| Differential Atitude Test | 443 | .81 |
| Henmon Nelson Test of Mental Maturity | 152 | .71 |
| Kuhlmann-Anderson Intelligence Test | 36 | .80 |
| Lorge-Thorndike Intelligence Test | 170 | .72 |
| Otis-Lennnon Mental Ability Test | 530 | .81 |
The magnitudes of the correlations between the AFQT (using the age-referenced percentile scores) and classic IQ tests are as high as or higher than the observed correlations of the classic IQ tests with each other. For example, the best-known adult test, the WAIS, is known to correlate (using the median correlation with various studies, and not correcting for restriction of range in the samples) with the Stanford-Binet at .77, with the Ravens Standard Progressive Matrices at .72, the SRA Non-verbal test at .81, the Peabody Picture Vocabulary Test at .83, and the Otis at .78.
14
The table below summarizes the intercorrelations of IQ tests, based on the comparisons assembled by Arthur Jensen as of 1980, and adding a line for the AFQT comparisons from the NLSY. The AFQT compares favorably with the other major IQ tests by this measure, which in turn is consistent with the high
g-
loading of the AFQT.
| Correlations of the Major IQ Tests with Other Standardized Mental Tests | |
|---|---|
| | Median Correlation with Other Mental Tests |
| Source: Jensen 1980, Table 8.5, and authors’ analysis of the NLSY. | |
| AFQT (age-referenced, 1989 scoring) | .81 |
| Wechsler-Bellevue I | .73 |
| Wechsler Adult Intelligence Scale (WAIS) | .77 |
| Wechsler Intelligence Scale for Children | .64 |
| Stanford-Binet | .71 |
Any good test designed to measure a complex ability (whether a test of cognitive ability or carpentry ability) will have several characteristics that common sense says are desirable: a large number of items, a wide range of difficulty among the items, no marked gaps in the difficulty of the items, a variety of types of items, and items that have some relationship to each other (i.e., are to some degree measuring the same thing).
15
Empirically, tests with these characteristics, administered to a representative sample of those for whom the test is intended, will yield scores that are spread out in a fashion resembling a normal distribution, or a bell curve. In this sense, tests of mental ability are not designed to produce normally distributed scores; that’s just what happens, the same way that height is normally distributed without anyone planning it.
It is also true, however, that tests are usually scored and standardized under the assumption that intelligence is normally distributed, and this has led to allegations that psychometricians have bamboozled people into accepting that intelligence is normally distributed, when in fact it may just be an artifact of the way they choose to measure intelligence. For a response to such allegations, Chapter 4 of Arthur Jensen’s
Bias in Mental Testing
(New York: Free Press, 1980) remains the best discussion we have seen.
For purposes of assessing the analyses in this book, it may help readers to know the extent to which any assumptions about the distribution of AFQT scores might have affected the results, especially since we
rescored the AFQT to correct for skew (see Appendix 2). The descriptive statistics showing the breakdown of each variable by cognitive class, presented in each chapter of Part II, address that issue. Assignment to cognitive classes was based on the subject’s rank within the distribution, and these ranks are invariant no matter what the normality of the distribution might be. Ranks were also unaffected by the correction for skew.
The descriptive statistics in the text were bivariate. To examine this issue in a multivariate framework, we replicated the analyses of Part II substituting a set of nominal variables, denoting the cognitive classes, for the continuous AFQT measure. That is, the regression treated “membership in Class I” as a nominal variable, just as it would treat “married” or “Latino” as a nominal characteristic—and similarly for the other four cognitive classes, also entered as nominal variables (See Appendix 4 for a discussion of how to interpret the coefficients for nominal variables as created by the software used in these analyses, JMP 3.0). Below, we show the results for the opening analysis of Part II (Chapter 5), the probability of being in poverty.
Comparison of results when AFQT is treated as a continuous, normally distributed variable and when it is treated as a set of nominal categories based on groupings by centile
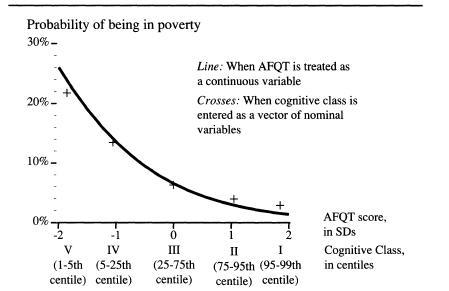
Note: For computing the plot, age and SES were set at their mean values.
| | | Whole-Model Test | | |
| Source | DF | -LogLikelihood | ChiSquare | Prob>ChiSq |
| Model | 3 | 477222.0 | 954443.9 | 0.000000 |
| Error | 4488 | 4587166.7 | null | |
| C Total | 4491 | 5064388.7 | null | |
| | RSquare (U) | 0.0942 | | |
| | Observation | 4,492 | |
| | Parameter Estimates | | ||
| Term | Estimate | Std Error | ChiSquare | Prob>Chisq |
| Intercept | -2.6579692 | 0.0009826 | . | 0.0000 |
| zAFQT89 | -0.8177031 | 0.0012228 | 447179 | 0.0000 |
| zSES | -0.2744971 | 0.0011661 | 55416 | 0.0000 |
| zAge | -0.0482156 | 0.0009187 | 2754.1 | 0.0000 |