Read The Bell Curve: Intelligence and Class Structure in American Life Online
Authors: Richard J. Herrnstein,Charles A. Murray
Tags: #History, #Science, #General, #Psychology, #Sociology, #Genetics & Genomics, #Life Sciences, #Social Science, #Educational Psychology, #Intelligence Levels - United States, #Nature and Nurture, #United States, #Education, #Political Science, #Intelligence Levels - Social Aspects - United States, #Intellect, #Intelligence Levels
The Bell Curve: Intelligence and Class Structure in American Life (58 page)

The Demographic Transition Elsewhere
The generalizations in the text may be stated with confidence about most communities in the West. Elsewhere, there is still much to be learned. Japan has passed through the demographic transition in that overall fertility has dropped, but reproduction has not shifted as markedly toward the lower end of the scale of privilege as in the Western democracies.
11
The reason may be that in Japan, as in other East Asian societies, social obligations that encourage childbearing among the educated may take precedence over the individualistic motives that might otherwise compete with parenthood. Similar considerations may apply to Islamic communities as well, where the demographic transition has been weak. The Mormons offer an American example of a weak demographic transition.
12
An account of the patterns of reproduction must consider cultural, personal, religious, and familial factors, as well as the more obvious social variables, such as the rising levels of education, women’s employment, and public health.
13
Whatever the reasons and whatever the variations from community to community, the reality of the demographic transition in the modern West is indisputable and so, it would seem, is the implication. If reproductive rates are correlated with income and educational levels, which are themselves correlated with intelligence, people with lower intelligence would presumably be outreproducing people with higher intelligence and thereby producing a dysgenic effect.
14
Can we find evidence that dysgenesis is actually happening?
The early studies from the United States, England, France, and Greece all seemed to confirm the reality of dysgenesis.
15
In the 1930s, the eminent psychometrician Raymond Cattell was predicting a loss of 1.0 to 1.5 IQ points per decade,
16
while others were publishing estimated losses of 2 to 4 IQ points per generation.
17
In 1951, another scholar gloomily predicted that “if this trend continues for less than a century,
England and America will be well on the way to becoming nations of near half-wits.”
18
The main source of their pessimism was that the average IQ in large families was lower than in smaller families.
Then came a period of optimism. Its harbinger was Frederick Osborn’s Eugenic Hypothesis, first stated in 1940, which foresaw a eugenic effect arising from greater equality of social and economic goods and wider availability of birth control.
19
In the late 1940s, data began to come in that seemed to confirm this more sanguine view. Surveys in Scotland found that Scottish school children were getting higher IQs, not lower ones, despite the familiar negative relationship between family size and IQ.
20
Examining this and other new studies, Cattell reconsidered his position, concluding that past estimates might not have adequately investigated the relationship between intelligence and marriage rates, which could have skewed their results.
21
The new optimism got a boost in 1962 with the publication of “Intelligence and Family Size: A Paradox Resolved,” in which the authors, using a large Minnesota sample, showed how it was possible to have both a negative relationship between IQ and family size and, at the same time, to find no dysgenic pattern for IQ.
22
The people who had no children, and whose fertilities were thus omitted from the earlier statistics, the authors suggested, came disproportionately from the lower IQ portion of the population. From the early 1960s through 1980, a series of studies were published showing the same radically changed picture: slowly rising or almost stable intelligence from generation to generation, despite the lower average IQs in the larger families.
23
The optimism proved to be ephemeral. As scholars examined new data and reexamined the original analyses, they found that the optimistic results turned on factors that were ill understood or ignored at the time the studies were published. First, comparisons between successive generations tested with the same instrument (as in the Scottish studies) were contaminated by the Flynn effect, whereby IQ scores (though not necessarily cognitive ability itself) rise secularly over time (see Chapter 13). Second, the samples used in the most-cited optimistic studies published in the 1960s and 1970s were unrepresentative of the national population. Most of them came from nearly all-white populations of states in the upper Midwest.
24
Two of the important studies published during this period were difficult to interpret because they were based not only on whites but on males (estimating fertility among males poses numerous problems, and male fertility can be quite different
from female fertility) and on samples that were restricted to the upper half of the ability distribution, thereby missing what was going on in the lower half.
25
Apart from these technical problems, however, another feature of the studies yielding optimistic results in the 1960s and 1970s limited their applicability: They were based on the parents of the baby boomers, the children born between 1945 and about 1960. In 1982, demographer Daniel Vining, Jr., opened a new phase of the debate with the publication of his cautiously titled article, “On the Possibility of the Reemergence of a Dysgenic Trend with Respect to Intelligence in American Fertility Differentials.”
26
Vining presented data from the National Longitudinal Survey cohorts selected in 1966 and 1968 (the predecessors of the much larger 1979 NLSY sample that we have used so extensively) supporting his hypothesis that people with higher intelligence tend to have fertility rates as high as or higher than anyone else’s
in periods of rising fertility
but that in periods of falling birth rates, they tend to have lower fertility rates. The American fertility rate had been falling without a break since the late 1950s, as the baby boom subsided, and Vining suspected that dysgenesis was again underway.
Then two researchers from the University of Texas, Marian Van Court and Frank Bean, finding no evidence for any respite during the baby boom in a nationally representative sample, determined that the childless members of the sample were not disproportionately low IQ at all; on the contrary, they had slightly higher IQs than people with children. Van Court and Bean concluded that the United States had been experiencing an unbroken dysgenic effect since the early years of the century.
27
Since then, all the news has been bad. Another study of the upper Midwest looked at the fertilities in the mid-1980s of a nearly all-white sample of people in Wisconsin who had been high school seniors as of 1957 and found a dysgenic effect corresponding to about 0.8 IQ point per generation.
28
A 1991 study based on a wholly different approach and using the NLSY suggests that 0.8 per generation may be an underestimate.
29
This study estimated the shifting ethnic makeup of the population, given the differing intrinsic birth rates of the various ethnic groups. Since the main ethnic groups differ in average IQ, a shift in America’s ethnic makeup implies a change in the overall average IQ. Even disregarding the impact of differential fertility within ethnic groups, the shifting ethnic makeup by itself would lower the average American IQ
by 0.8 point per generation. Since the differential fertility within those ethnic groups is lowering the average score for each group itself (as we show later in the chapter), the 0.8 estimate is a lower bound of the overall population change.
To summarize, there is still uncertainty about whether the United States experienced a brief eugenic interlude after World War II. Van Court and Bean conclude it has been all downhill since the early part of the twentieth century; other researchers are unsure.
30
There is also uncertainty deriving from the Flynn effect. James Flynn has by now convinced everyone that IQ scores rise over time, more or less everywhere they are studied, but there remains little agreement about what that means. For those who believe that the increase in scores represents authentic gains in cognitive ability, the dysgenic effects may be largely swamped by overall gains in the general environment. For those who believe that the increases in scores are primarily due to increased test sophistication without affecting
g,
the Flynn effect is merely a statistical complication that must be taken into account whenever comparing IQ scores from different points in time or across different cultures.
But within the scholarly community, there is little doubt about differential fertility or about whether it is exerting downward pressure on cognitive ability. Further, the scholarly debate of the last fifty years has progressed: The margin of error has narrowed. Scientific progress has helped clarify the dysgenic effects without yet producing a precise calibration of exactly how much the distribution of cognitive ability is declining. This leads to our next topic, the current state of affairs.
Foretelling the future about fertility is a hazardous business, and foretelling it in terms of IQ points per generation is more hazardous still. The unknowns are too many. Will the ranks of career women continue to expand? Or might our granddaughters lead a revival of the traditional family? How will the environmental aspects of cognitive development change (judging from what has happened to SAT scores, it could be for worse as well as better)?
31
Will the Flynn effect continue? Even if it does, what does it mean? No one has any idea how these countervailing forces might play out.
For all these reasons, we do not put much confidence in any specific predictions about what will happen to IQ scores decades from now. But
we can say with considerable confidence what is happening right now, and the news is worrisome.
32
There are three major factors to take into account: the number of children born to women at various IQ levels, the age at which they have them, and the cognitive ability of immigrants.
Demographers often take a lifetime fertility of about 2.1 births as the dividing line between having enough children to replenish the parent generation and having too few.
33
Bear that in mind while examining the figure below showing the “completed fertility”—all the babies they have ever had—of American women who had virtually completed their childbearing years in 1992, broken down by their educational attainment. Overall, college graduates had 1.56 children, one child less than the average for women without a high school diploma. Let us consider the ratio of the two fertilities as a rough index of the degree to which fertility is tipped one way or the other with regard to education. A ratio greater than 1.0 says the tip is toward the lower educational levels. The actual ratio is 1.71, which can be read as 71 percent more births among high school dropouts than among women who graduated from college. At least since the 1950s, the ratio in the United States has been between 1.5 and 1.85.
34
The higher the education, the fewer the babies
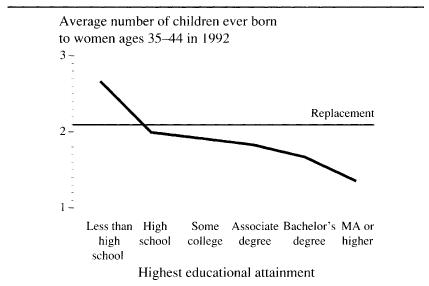
Source:
Bachu 1993, Table 2.
What does this mean for IQ? We may compute an estimate by using what we know about the mean IQs of the NLSY women who reached various levels of education. Overall, these most recent data on American fertility (based on women ages 35 to 44 in 1992, when the survey was taken) implies that the overall average IQ of American mothers was a little less than 98.
35
This is consistent with the analyses of American fertility that suggest a decline of at least 0.8 point per generation.
This estimate is strengthened by using an altogether different slice of the national picture, based on the birth statistics for virtually all babies born in the United States in a given year, using the data compiled in
Vital Statistics
by the National Center for Health Statistics (NCHS). The most recent data available as we write, for 1991, provide modestly good news: The proportions of children born to better-educated women—and therefore higher-IQ women, on average—have been going up in the last decade. The proportion of babies born to women with sixteen or more years of school (usually indicating a college degree or better) rose from 4.8 percent in 1982 to 5.9 percent in 1991. The proportion of babies born to women with something more than a high school diploma rose from 34-2 percent to 38.2 percent—small changes but in the right direction. The bad news is that the proportion of children born to women with less than a high school education has risen slightly over the last decade, from 22 percent to 24 percent, attributable to an especially steep rise among white women since 1986.
In trying to use the educational information in
Vital Statistics
to estimate the mean IQ of mothers in 1991, it is essential to anticipate the eventual educational attainment of women who had babies while they were still of school age. After doing so, as described in the note,
36
the estimated average IQ of women who gave birth in 1991 was 98. Considering that census data and the
Vital Statistics
data come from different sources and take two different slices of the picture, the similarities are remarkable. The conclusion in both cases is that differential fertility is exerting downward pressure on IQ. At the end of the chapter, we show how much impact changes of this size may have on American society.
