Read The Bell Curve: Intelligence and Class Structure in American Life Online
Authors: Richard J. Herrnstein,Charles A. Murray
Tags: #History, #Science, #General, #Psychology, #Sociology, #Genetics & Genomics, #Life Sciences, #Social Science, #Educational Psychology, #Intelligence Levels - United States, #Nature and Nurture, #United States, #Education, #Political Science, #Intelligence Levels - Social Aspects - United States, #Intellect, #Intelligence Levels
The Bell Curve: Intelligence and Class Structure in American Life (62 page)

Social Behavior and the Prevalence of Low Cognitive Ability
In this chapter, the question is not whether low cognitive ability causes social problems but the prevalence of low cognitive ability among people who have those problems. It is an important distinction. Causal relationships are complex and hard to establish definitely. The measure of prevalence is more straightforward. For most of the worst social problems of our time, the people who have the problem are heavily concentrated in the lower portion of the cognitive ability distribution. Any practical solution must therefore be capable of succeeding with such people.
T
his chapter brings together the social behaviors we covered in Part II from a new vantage point. The earlier chapters showed that low cognitive ability raises the risk of living in conditions or behaving in ways that society hopes to change. Now the question concerns prevalence: To what extent does low cognitive ability describe the people thus afflicted? The distinction is more familiar in the medical context. High cholesterol may be a risk factor for heart disease, but most people with heart disease may or may not have high cholesterol. If most people who have heart attacks do not have high cholesterol, then lowering the cholesterol of those with high levels will not do much to reduce the frequency of heart attacks in the population at large. Similarly, to the extent that low cognitive ability is prevalent among people who have the problems we hope to solve, policies that are effective for people with low scores should be sought.
The entire NLSY sample, including the Asian-Americans, American
Indians, and other ethnic groups that have hitherto been excluded, are used here. The proportions presented in this chapter are representative of America’s national population for an age cohort that was 26 to 33 as of 1990.
In 1989, the official national statistics revealed that 11.1 percent of persons ages 25 to 34 years old were poor in that year, virtually identical with the 10.9 percent below the poverty line in the NLSY sample ages 25 to 33. So while the NLSY cannot give us a precise figure for overall national poverty, there is no reason to think that the results from it are misleading for young adults. This is in preface to the sobering figure that follows.
Forty-eight percent of the poor in 1989 came from the bottom 20 percent in intelligence
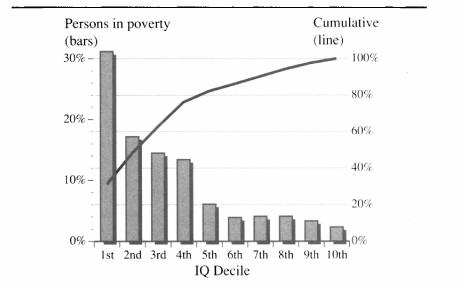
This graph uses conventions that we follow throughout the chapter: The headline gives the percentage of the population in question (in this instance, the poor) in the bottom 20 percent of IQ, and the scale is the same for each graph. The bars show the percentage of the poor population who come from each decile, marked by the scale on the left. If cognitive ability were irrelevant to poverty, the bars would be of equal
height, each at just 10 percent. Adding up the percentages in each bar from left to right gives the cumulative percentage, shown by the black line and the right-hand scale. For example, the first two deciles add up to 48 percent; therefore the black line crosses the 48 percent mark at the second bar. The cumulative scale is a way of showing what proportion of poor people fall below any given decile. For example, in the case of poverty, almost 80 percent of poor people are in or below the fourth decile. If cognitive ability were irrelevant, the line would be a straight diagonal from lower left to the upper right.
In terms of IQ points, the cognitive ability deciles in the figure above, as in all the others in the chapter, correspond to the scores in the table below. The bottom two deciles cut off IQ 87 and below and the top two deciles cut off IQ 113 and above. It may also be useful to recall that most college graduates and almost everyone with a professional degree fall in the ninth and tenth deciles.
| IQ Equivalents for the Deciles | ||
|---|---|---|
| Decile | Range | Median |
| 1st | Under 81 | 74 |
| 2d | 81-87 | 84 |
| 3d | 87-92 | 90 |
| 4th | 92-96 | 94 |
| 5th | 96-100 | 98 |
| 6th | 100-104 | 102 |
| 7th | 104-108 | 106 |
| 8th | 108-113 | 110 |
| 9th | 113-119 | 116 |
| 10th | Above 119 | 126 |
The figure tells us forcefully that poverty is concentrated among those with low cognitive ability. The mean IQ of people below the poverty line was 88. A third of them came from the very bottom decile; they had IQs under 81. Eighty-two percent had below-average IQs.
It will come as no surprise to find that most high school dropouts have low intelligence. The figure below shows the results for persons who
dropped out of school and did not subsequently obtain a GED. Overall, 94 percent of those who permanently dropped out of school were below average in IQ. As we noted in Chapter 6, this disproportion is not materially affected by analyses limited to persons who took the intelligence test before they dropped out, so it cannot be explained by the effects of a lack of schooling on their IQs.
Two-thirds of high school dropouts came from the bottom 20 percent in intelligence
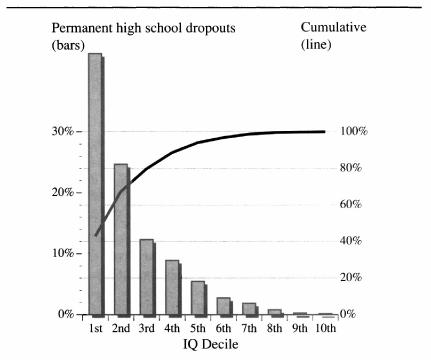
Those who drop out of school and later return to get their GED are markedly below the mean of those who finish high school in the normal way, but they are not as severely skewed toward the bottom end of the distribution. Twenty-five percent are in the bottom two IQ deciles, and 69 percent are in the bottom half of the distribution.
Year-round employment has only a minor association with cognitive ability.
The figure below, based on men who worked fifty-two weeks in 1989,
makes this point plainly. We italicize it because, although it is consistent with the analysis presented for whites in Chapter 7, we want to emphasize that the same result applies across ethnic groups.
Seventeen percent of the men who worked year round in 1989 were in the bottom 20 percent of intelligence
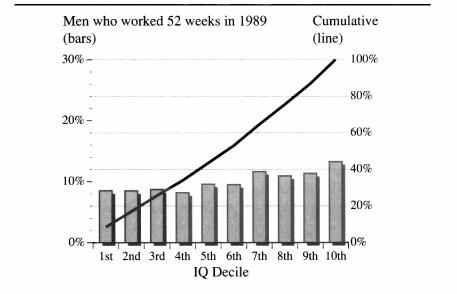
By and large, men who were employed throughout 1982 were spread across the full range of IQs, with only a minor elevation for those in the top four deciles. The mean IQ of year-round workers was 102. Those with low IQ have a statistically tougher time in many ways, but they contribute very nearly their full share to the population of men employed year round, an important fact to remember as a counterweight to most of the other findings in this chapter.
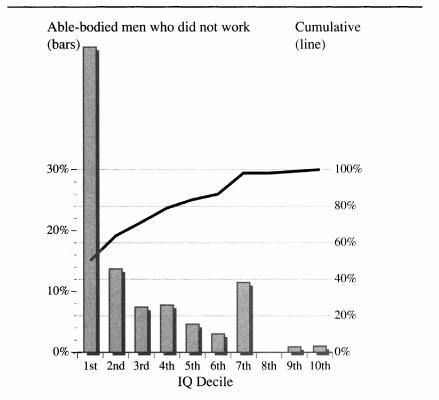
The prototypical member of the underclass in the public imagination is a young male hanging out on the streets, never working. This amounted to very few men. Only 2.2 percent of NLSY men not in school and not prevented from working because of health problems failed to work at least a week in 1989. But among these 2.2 percent, low cognitive ability
predominated. The figure below, limited to civilian men out of school and not physically prevented from working, combines those who said they were unemployed and those who said they had dropped out of the labor force; their common denominator is that they reported zero weeks of working for 1989. The mean IQ of men who did not work at all was 84. Fifty percent were in the bottom decile. Eighty-four percent were below average.
Sixty-four percent of able-bodied men who did not work in 1989 were in the bottom 20 percent of intelligence
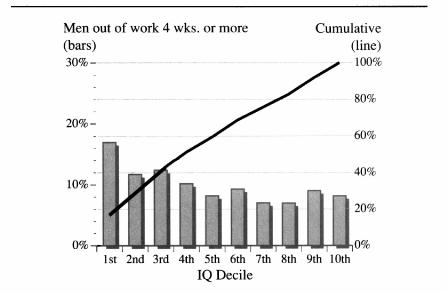
Now we turn to the men not represented in either of the two figures above: men who worked at least some time during 1989 but were out of work for more than four weeks. There was somewhat more unemployment among the lower deciles of IQ, as the figure below shows, but, as the almost straight diagonal line shows, the relationship was not strong.
For these men, the mean IQ was 97, three points below average. If we were to add another graph, for men who were out of work for six months but not the full year, it would show a stronger relationship, about halfway between the graph just above and the earlier graph for men who were out of the labor force all year. The general principle is that the longer the period of unemployment, the more prevalent is low IQ. Short-term unemployment is not conspicuously characterized by low IQ; long-term unemployment is.
Twenty-nine percent of able-bodied men who were temporarily out of work in 1989 were in the bottom 20 percent of intelligence
The next figure contains the breakdown of the IQs of men in the NLSY who were interviewed in a correctional facility, showing that they had committed at least one offense serious enough to get them locked up. The mean IQ of men who were ever interviewed in a correctional facility was 84. Forty-five percent were concentrated in the bottom decile of cognitive ability. Ninety-three percent of the men were somewhere in the bottom half of the cognitive ability distribution. This high prevalence of low IQ among offenders is consistent with other estimates in the literature, as summarized in Chapter 11.
