Read The Bell Curve: Intelligence and Class Structure in American Life Online
Authors: Richard J. Herrnstein,Charles A. Murray
Tags: #History, #Science, #General, #Psychology, #Sociology, #Genetics & Genomics, #Life Sciences, #Social Science, #Educational Psychology, #Intelligence Levels - United States, #Nature and Nurture, #United States, #Education, #Political Science, #Intelligence Levels - Social Aspects - United States, #Intellect, #Intelligence Levels
The Bell Curve: Intelligence and Class Structure in American Life (61 page)

In the 1960s and 1970s, America became much more of a welfare state. Consistent with that, the earnings potential of the Latino immigrant group fell substantially from 1955 through 1980. Among the non-European countries, three of the four steepest declines in earnings potential were among immigrant groups from Colombia, the Dominican Republic, and Mexico, all large contributors to the Latin American immigrant population. Many of the other countries were not included in Borjas’s forty-one countries, so we do not know whether they followed the same pattern. Among the Latin American and Latino-Caribbean nations, only the immigrant groups from Cuba, Brazil, and Panama had
improving potential by Borjas’s measures. The 1980 Mexican wave of immigrants had an earnings potential about 15 percent lower than the wave that arrived in 1955. For the Dominican Republic and Colombia, the earnings potential of the 1980 wave was more than 30 percent lower than those who came in 1955, a decline that remains
after
holding education, marital status, age, and location constant.
62
Similarly, the success of the early waves of West Indian blacks seems unlikely to repeat itself. In his book
Ethnic America,
Thomas Sowell described the successes of West Indian black immigrants, starting from early in the twentieth century, noting among other things that, by 1969, second-generation West Indian blacks had a higher mean income than whites.
63
His account has since become widely cited as evidence for everything from the inherent equality of black and white earning ability to the merits of unrestricted immigration. The Borjas data include three of the major contributors of black immigrants from that region: Jamaica, Haiti, and Trinidad/Tobago. The earnings potential of the immigrant cohorts from these countries in 1970 ranged from 31 to 34 percent less than American natives (after holding education, marital status, age, and location constant).
64
In 1980, the earnings potential from the most recent immigrant waves from these three countries ranged from 26 to 52 percent less than American natives. Immigrants from all three countries are on an extremely slow route to income equality, with Jamaicans and Haitians lagging behind everyone except the lowest-ranking Latin American countries. Borjas’s study did not include immigrants from any countries in sub-Saharan Africa.
The results for European immigrants were also consistent with the theory. Borjas’s overall appraisal of the data is worth quoting in full:
The empirical analysis of the earnings of immigrants from 41 different countries using the 1970 and 1980 censuses shows that there are strong country-specific fixed effects in the (labor market) quality of foreign-born persons. In particular, persons from Western European countries do quite well in the United States, and their cohorts have exhibited a general
increase
in earnings (relative to their measured skills) over the postwar period. On the other hand, persons from less developed countries do not perform well in the U.S. labor market and their cohorts have exhibited a general
decrease
in earnings (relative to their measured skills) over the postwar period.
65
These analyses should not obscure the energy and ability that we often see among immigrants, whether they are staffing the checkout counter at the corner convenience store or teaching classes in the nation’s most advanced research centers. The observations of everyday life and the statistical generalizations we have just presented can both be true at the same time, however.
Putting the pieces together—higher fertility and a faster generational cycle among the less intelligent and an immigrant population that is probably somewhat below the native-born average—the case is strong that something worth worrying about is happening to the cognitive capital of the country. How big is the effect? If we were to try to put it in terms of IQ points per generation, the usual metric for such analyses, it would be nearly impossible to make the total come out to less than one point per generation. It might be twice that. But we hope we have emphasized the complications enough to show why such estimates are only marginally useful. Even if an estimate is realistic regarding the current situation, it is impossible to predict how long it may be correct or when and how it may change. It may shrink or grow or remain stable. Demographers disagree about many things, but not that the further into the future we try to look, the more likely our forecasts are to be wrong.
This leads to the last issue that must be considered before it is fruitful to talk about specific demographic policies. So what if the mean IQ is dropping by a point or two per generation? One reason to worry is that the drop may be enlarging ethnic differences in cognitive ability at a time when the nation badly needs narrowing differences. Another reason to worry is that when the mean shifts a little, the size of the tails of the distribution changes a lot. For example, assuming a normal distribution, a three-point drop at the average would reduce the proportion of the population with IQs above 120 (currently the top decile) by 31 percent and the proportion with IQs above 135 (currently the top 1 percent) by 42 percent. The proportion of the population with IQs below 80 (currently the bottom decile) would rise by 41 percent and the proportion with IQs below 65 (currently the bottom 1 percent) would rise by 68 percent. Given the predictive power of IQ scores, particularly in the extremes of the distribution, changes this large would profoundly
alter many aspects of American life, none that we can think of to the good.
Suppose we select a subsample of the NLSY, different in only one respect from the complete sample: We randomly delete persons who have a mean IQ of more than 97, until we reach a sample that has a mean IQ of 97—a mere three points below the mean of the full sample.
66
How different do the crucial social outcomes look? For some behaviors, not much changes. Marriage rates do not change. With a three-point decline at the average, divorce, unemployment, and dropout from the labor force rise only marginally. But the overall poverty rate rises by 11 percent and the proportion of children living in poverty throughout the first three years of their lives rises by 13 percent. The proportion of children born to single mothers rises by 8 percent. The proportion of men interviewed in jail rises by 13 percent. The proportion of children living with nonparental custodians, of women ever on welfare, and of people dropping out of high school all rise by 14 percent. The proportion of young men prevented from working by health problems increases by 18 percent.
This exercise assumed that everything else but IQ remained constant. In the real world, things would no doubt be more complicated. A cascade of secondary effects may make social conditions worse than we suggest or perhaps not so bad. But the overall point is that an apparently minor shift in IQ could produce important social outcomes. Three points in IQ seem to be nothing (and indeed, they
are
nothing in terms of understanding an individual’s ability), but a population with an IQ mean that has slipped three points is likely to be importantly worse off. Furthermore, a three-point slide in the near-term future is well within the realm of possibility. The social phenomena that have been so worrisome for the past few decades may in some degree already reflect an ongoing dysgenic effect. It is worth worrying about, and worth trying to do something about.
At the same time, it is not impossible to imagine more hopeful prospects. After all, IQ scores are rising with the Flynn effect. The nation can spend more money more effectively on childhood interventions and improved education. Won’t these tend to keep this three-point fall and its consequences from actually happening? They may, but whatever good things we can accomplish with changes in the environment would be that much more effective if they did not have to
fight a demographic head wind. Perhaps, for example, making the environment better could keep the average IQ at 100, instead of falling to 97 because of the demographic pressures. But the same improved environment could raise the average to 103, if the demographic pressures would cease.
How Would We Know That IQ Has Been Falling?
Can the United States really have been experiencing falling IQ? Would not we be able to see the consequences? Maybe we have. In 1938, Raymond Cattell, one of most illustrious psychometricians of his age, wrote an article for the
British Journal of Psychology,
“Some Changes in Social life in a Community with a Falling Intelligence Quotient.”
67
The article was eerily prescient.In education, Cattell predicted that academic standards would fall and the curriculum would shift toward less abstract subjects. He foresaw an increase in “delinquency against society”—crime and willful dependency (for example, having a child without being able to care for it) would be in this category. He was not sure whether this would lead to a slackening of moral codes or attempts at tighter government control over individual behavior. The response could go either way, he wrote.
He predicted that a complex modern society with a falling IQ would have to compensate people at the low end of IQ by a “systematized relaxation of moral standards, permitting more direct instinctive satisfactions.”
68
In particular, he saw an expanding role for what he called “fantasy compensations.” He saw the novel and the cinema as the contemporary means for satisfying it, but he added that “we have probably not seen the end of its development or begun to appreciate its damaging effects on ‘reality thinking’ habits concerned in other spheres of life”—a prediction hard to fault as one watches the use of TV in today’s world and imagines the use of virtual reality helmets in tomorrow’s.
69Turning to political and social life, he expected to see “the development of a larger ‘social problem group’ or at least of a group supported, supervised and patronized by extensive state social welfare work.” This, he foresaw, would be “inimical to that human solidarity and potential equality of prestige which is essential to democracy.”
70
Suppose that downward pressure from demography stopped and maybe modestly turned around in the other direction—nothing dramatic, no eugenic surges in babies by high-IQ women or draconian measures to stop low-IQ women from having babies, just enough of a shift
so that the winds were at least heading in the right direction. Then improvements in education and childhood interventions need not struggle to keep us from falling behind; they could bring real progress. Once again, we cannot predict exactly what
would
happen if the mean IQ rose to 103, for example, but we can describe what
does
happen to the statistics when the NLSY sample is altered so that its subjects have a mean of 103.
71
For starters, the poverty rate falls by 25 percent. So does the proportion of males ever interviewed in jail. High school dropouts fall by 28 percent. Children living without their parents fall by 20 percent. Welfare recipiency, both temporary and chronic, falls by 18 percent. Children born out of wedlock drop by 15 percent. The incidence of low-weight births drops by 12 percent. Children in the bottom decile of home environments drop by 13 percent. Children who live in poverty for the first three years of their lives drop by 20 percent.
The stories of falling and rising IQ are not mirror images of each other, in part for technical reasons explained in the note and partly because the effects of above-and below-average IQ are often asymmetrical.
72
Once again, we must note that the real world is more complex than in our simplified exercise. But the basic implication is hard to dispute: With a rising average, the changes are positive rather than negative.
Consider the poverty rate for people in the NLSY as of 1989, for example. It stood at 11.0 percent.
73
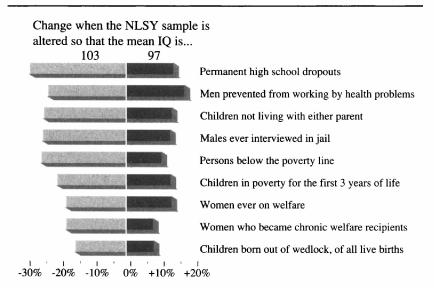
The same sample, depleted of above-97 IQ people until the mean was 97, has a poverty rate of 12.2 percent. The same sample, depleted of below-103 IQ people until the mean was 103, has a poverty rate of 8.3 percent. This represents a swing of almost four percentage points—more than a third of the actual 1989 poverty problem as represented by the full NLSY sample. Suppose we cast this discussion in terms of the “swing.” The figure below contains the indicators that show the biggest swing.
A swing from an average IQ of 97 to 103 in the NLSY reduces the proportion of people who never get a high school education by 43 percent, of persons below the poverty line by 36 percent, of children living in foster care or with nonparental relatives by 38 percent, of women ever on welfare by 31 percent. The list goes on, and shows substantial reductions for other indicators discussed in Part II that we have not included in the figure.
The nation is at a fork in the road. It will be moving somewhere within this range of possibilities in the decades to come. It is easy to understand
the historical and social reasons why nobody wants to talk about the demography of intelligence. Our purpose has been to point out that the stakes are large and that continuing to pretend that there’s nothing worth thinking about is as reckless as it is foolish. In Part IV, we offer some policies to point the country toward a brighter demographic future.
The swing in social problems that can result from small shifts in the mean IQ of a population