The Crash Course: The Unsustainable Future of Our Economy, Energy, and Environment (18 page)
Read The Crash Course: The Unsustainable Future of Our Economy, Energy, and Environment Online
Authors: Chris Martenson
Tags: #General, #Economic Conditions, #Business & Economics, #Economics, #Development, #Forecasting, #Sustainable Development, #Economic Development, #Economic Forecasting - United States, #United States, #Sustainable Development - United States, #Economic Forecasting, #United States - Economic Conditions - 2009

The higher inflation readings offered by Mr. Williams comport better with the economic news than do the (much) lower government readings. They fit better with the observation that most people have had to borrow more and were able to save less over time—because their real income was actually a lot lower than reported. It explains why the elderly on fixed incomes have been having a harder and harder time making ends meet. A higher rate of inflation is consistent with weak labor markets and growing levels of debt, two stubborn features of the current economic landscape. This higher rate of inflation matches up well with the observed rates of monetary growth throughout the 1990s and early 2000s. So many things that were difficult to explain under the low-inflation readings offered by the government suddenly make sense when we adopt a higher rate of inflation into our mental framework. We can either conclude that we are misperceiving all of those other things, or conclude that the inflation reading is the skewed statistic.
The social cost to this self-deception is enormous. For starters, if inflation were calculated the way it used to be, Social Security payments, whose cost of living adjustment (COLA) increases are based on the CPI, would be 70 percent higher than they currently are.
8
Because Medicare increases are also tied to the woefully understated CPI, hospitals are receiving lower Medicare reimbursements than they otherwise would and are increasingly unable to balance their budgets, forcing many communities to choose between closing their hospitals and cutting off service to Medicare recipients. A little harmless fibbing and self-deception is one thing; losing your only community hospital is quite another. These are a few of the grave impacts in our daily lives that result from living with a statistically tortured CPI.
But aside from paying out less in entitlement checks, politicians gain in another very important way by understating inflation.
Gross Domestic Product (GDP)
Gross domestic product (GDP) is how we tell ourselves that our economy is either doing well or doing poorly. In theory, the GDP is the sum total of all value-added transactions within our country in any given year. Just like the CPI (inflation measure), the GDP measure has been so twisted and tweaked by government statisticians that it no longer tells a recognizable version of the truth. As before, there was no sudden, secret adjustment where GDP slipped off the rails; it has been stealthily and systematically debased under every presidential administration since the 1960s, like an old house with a thriving termite colony.
Here is an example of just how far from reality GDP has strayed: The reported GDP amount for 2003 was $11 trillion, implying that $11 trillion of money-based, value-added economic transactions occurred. But that did not actually happen. To begin with, that $11 trillion included $1.6 trillion of so-called imputation adjustments, where economic value was assumed (“imputed”) to have been created, but where no cash transactions had actually taken place. Despite the fact that there was no trade and nothing changed hands, a value was still assigned to these assumptions and reported as part of the GDP.
The largest imputation represents something called “owner’s equivalent rent,” which assigns a value to the benefit that homeowners receive by not having to pay themselves rent. If you own your house free and clear, the government calculates “the amount of money owner occupants would have spent had they been renting.”
9
It’s not a trivial amount; it totaled $1.225 trillion in 2009.
10
Another is the benefit that you receive from the “free checking” provided by your bank, which is imputed to have a value because if it wasn’t free, then, as the logic goes, you’d have to pay for it. So a value is assigned to all the free checking in the land, and that, too, is added to the tally. Together, all of the imputations added up to $2.27 trillion dollars in 2009, out of a total reported national income of $13.94 trillion dollars, or 16 percent of the total.
11
Next, like the CPI, the GDP also has many elements that are hedonically adjusted. For instance, computers are hedonically adjusted to account for the prospect that faster and more feature-rich computers must be worth more to our economic output than prior models.
So if a computer costing $1,000 was sold, it would be recorded as contributing more than a thousand dollars to the GDP to account for the fact that it’s faster and more technologically advanced than the thousand-dollar model that was sold last year. Of course, that extra money is fictitious; it never traded hands and doesn’t actually exist. This is similar to a toilet paper manufacturer reporting higher revenues because its product was softer and fluffier this year, even though the same number of units was sold last year at the same price.
Admittedly, there are perfectly valid justifications for trying to adjust for the role of quality when measuring
price
changes. For example, if we were to compare a 1972 Ford Pinto, with its thin-walled gasoline tank and 8-track player, to a 2010 Camry with anti-lock brakes, CD sound system, driver and passenger airbags, and vastly improved drive train, and we were to find that the Camry had a higher market value than the Pinto, it would be unfair to attribute that price difference solely to inflation.
12
I feel it’s quite a stretch to then claim that an improvement in quality is the same thing as having sold more of that item, which is what the GDP purports to measure.
Interestingly, for the purposes of inflation measurements, hedonic adjustments are used to
reduce
the apparent price of computers, but for GDP calculations, hedonic adjustments are used to
boost
their apparent cash contribution to the nation’s economy. Using the magic of hedonics, government statisticians are able to simultaneously claim that computers cost less but are worth more—depending on whether the measurement is being applied to the CPI or the GDP, respectively.
So what were the total hedonic adjustments in 2003? An additional $2.3 trillion dollars.
13
Taken together, these mean that $3.9 trillion or fully 35 percent of 2003’s reported GDP wasn’t based on transactions that you could witness, record, or touch. They were guessed at, modeled, and/or imputed, but they did not show up in any bank accounts because no cash ever changed hands and no product was produced. These adjustments have served to vastly inflate the GDP and overstate the true economic health of the United States.
As an aside, when you read about how the United States’ “debt-to-GDP ratio is still quite low” or “income taxes as a percentage of GDP are at historically low levels,” it’s important to recall that because GDP is artificially inflated, any ratio where GDP is the denominator, such as debt-to-GDP and taxes-to-GDP, will be artificially low.
Inflation and GDP
Now let’s tie inflation into the GDP story. The GDP that you read about is always inflation-adjusted and reported after inflation is subtracted out. This is called “real” GDP, while the preinflation-adjusted number is called “nominal” GDP. Measuring the real output is an important thing to do, because GDP is supposed to measure real output, not inflation.
For example, if an entire economy consisted of producing nothing but lava lamps, with only one lamp being produced in one year and one of them the next year, we’d want to record the GDP growth rate as zero, because the output, or gross domestic product, was exactly the same in one year as the next. There was no growth in output; only one lava lamp was produced in each period.
However, if one lava lamp sold for $100 in the first year and one sold for $110 the next, we would accidentally record a 10 percent rate of growth in GDP if we didn’t back out the price increase. Remember, we’re trying to measure our gross domestic
product
, not inflated money flows (that would be a different measure). So in this example, in the second year, the
real
lava lamp economy has a value of $100, while the
nominal
lava lamp economy is worth $110. But we only care about the
real
economy, because what we’re trying to measure and report on is what was actually
produced
.
Now we’re in a position to appreciate a second powerful reason why DC politicians prefer a low-inflation reading. GDP is expressed in
real
terms, derived by subtracting inflation from the measured
nominal
quantities. In 3Q of 2007, reports indicated that the United States enjoyed a surprisingly strong 4.9 percent rate of GDP growth. At the time, there was a fair bit of rejoicing over this unexpectedly robust number. However, what we did not hear very much about was the fact that an astonishingly low inflation reading of only 1 percent was subtracted from the
nominal
GDP of 5.9 percent, giving us the final
real
result of 4.9 percent.
In order to accept the 4.9 percent figure, we have to first accept that the United States experienced only a 1 percent rate of inflation during a period when oil was shooting toward $100/barrel for the first time, medical insurance increases were measured in double digits, college tuition went up by high single digits, and food inflation was wracking the globe. What would have happened if a far more believable 3.5 percent rate of inflation had been used by the BEA? Reported GDP growth would have been a somewhat lackluster, if not entirely disappointing, 2.4 percent.
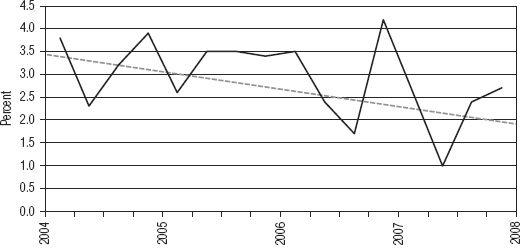
Lest you think that I’ve hand-picked an accidental, one-time statistical hiccup in the GDP reporting series, possibly due to significant one-time events that caused an unusually low 1 percent reading to occur, here’s a chart of the so-called GDP deflator (which is the specific measure of inflation that is subtracted from the nominal GDP to yield the reported real GDP).
As you can see in
Figure 13.1
, between 2004 and 2008 the clear trend has been for the Bureau of Economic Analysis to systematically subtract lower and lower amounts of inflation from nominal GDP, which doesn’t comport well at all with real-world inflation data over that period of time. Remember, each percent that inflation is
understated
equals a full percent that GDP is
overstated
.
I invite you to keep this in mind when you next read about how “our robust economy is still expanding,” or is “in recovery,” or any other pronouncement about the strength of the economy that relies upon the GDP as its yardstick. That measuring tool is no longer giving accurate or useful readings, due to the effects of imputations, hedonics, and deceptively low inflation readings.
In 2007, I began to trust my own assessment that the United States was experiencing higher inflation than reported, while checking my findings against those of John Williams. Because of the need to subtract this higher rate from the GDP, I started investing and interpreting the news as if we were in a period of solid recession, not respectable growth. Suddenly a lot of things that had previously been difficult for me to understand began to make perfect sense. Contracting businesses, rising foreclosures, job losses, rising budget deficits, falling tax revenues, declining auto sales—all of these were consistent with recession, not expansion. All of these warning signs were in plain view in 2007, long before a recession was officially recognized. Those trying to make sense of these economic events by viewing them through the government’s rose-tinted statistics were more likely to be confused than helped. Those in a position to appreciate how the game was rigged and then trust themselves to act wisely were able to navigate this period more successfully. When navigating uneven terrain, it helps tremendously if your instruments are reliable.