Read The Crash Course: The Unsustainable Future of Our Economy, Energy, and Environment Online
Authors: Chris Martenson
Tags: #General, #Economic Conditions, #Business & Economics, #Economics, #Development, #Forecasting, #Sustainable Development, #Economic Development, #Economic Forecasting - United States, #United States, #Sustainable Development - United States, #Economic Forecasting, #United States - Economic Conditions - 2009
The Crash Course: The Unsustainable Future of Our Economy, Energy, and Environment (13 page)

But let’s be absolutely clear here: The underlying reality is that each family still has exactly the same $50,000 of national income. They’re economically identical, except that one nation, Family B, is now saddled with debt equal to 100 percent of its income, while the other, Family A, isn’t. And ironically enough, Family B is being lauded, while Family A isn’t.
As it happens, the conventional way of measuring GDP (which is how all developed nations happen to measure it) doesn’t take into account the impact of debt—it completely ignores the accumulation of most forms of debt as if they do not matter. However, as I hope that our island nation example has made clear, debt is an absolutely critical component of the story, and excluding it paints a quite misleading picture.
This would become more obvious if we were to turn off the credit spigot and observe the fortunes of Family B immediately slamming into reverse. Where Family A would still be plodding along enjoying the very same $50,000 of income year after year, Family B, now deprived of credit, would find its income stream shredded by the amount of its interest payments. Too much prosperity in one period for Family B will be followed by too little in the next.
Debt-to-GDP for the high-borrowing family assures that they’ll be living under the strain of paying down those loans for years to come, which will weigh down their disposable income and future standard of living. To state this as a general rule, time spent living beyond one’s means necessitates a future period of living below one’s means. This is such a universal and often-repeated economic event that it is almost unbelievable to see that it’s about to make a “surprise” appearance on the world stage.
Because the conventional GDP measure neglects to factor out the use of credit/debt when measuring “growth,” it isn’t telling us everything we need to know. This oversight goes a long way toward explaining why the United States, along with every other debt-saturated country, is now in for a very painful adjustment process: Past growth was partially (and unsustainably) bolstered by debt, and future growth will be sapped by it.
Good Debt and Bad Debt
It’s time to distinguish between two major types of debt. Not all debt is bad or unproductive. Debt that can best be described as “investment debt” provides the means to pay itself back. An example would be a college loan securing the opportunity to earn a higher wage in the future. Another would be a loan to expand the seating at a successful restaurant. In the parlance of bankers, these are examples of “self-liquidating debt.” Because these kinds of loans will boost future revenues by enhancing productivity or increasing output, they self-generate the cash flows that will be used to pay them off in the future.
The other type of loan, however, is purely consumptive in nature, such as debt incurred for a fancier car, a vacation, new granite countertops, or perhaps a war that results in a large quantity of destroyed equipment. These loans don’t come with the means to pay themselves back. They are called “non–self-liquidating debts” (a mouthful of a term) because they don’t lead to additional future revenue, productivity, or profits. In our island nation example above, if we postulated that Family B had instead borrowed $50,000 for productive (and not consumptive) purposes, perhaps to build a factory which would then triple its income for the next twenty years, the entire story of which nation is in better financial shape? would shift. So not all debts are potentially harmful; only excess “non–self-liquidating” debt becomes a corrosive burden. Between 2000 and 2010, U.S. total credit market debt grew by more than $26 trillion, an unfortunately large proportion of which was of the non–self-liquidating variety. The implication is clear: Just like the island nation that borrowed and spent $50,000 on purely consumptive purchases, much of this debt load will translate into diminished standards of living in the future as it gets paid back out of a finite pool of income.
The key here is not to just look at the total pile of debt relative to income, but to look at how much of the debt has been spent on non–self-liquidating consumption, as opposed to investments boosting productivity and income.
The Crisis Explained in One Chart
Long before the economic crises of 2008 onward, I knew that such events were coming. While I admit to wallowing around in massive quantities of base data—I’m a scientist at heart, so data is a kind of like catnip for me—I found certainty about the trouble ahead in a single piece of evidence. The chart below, all on its own, led me to conclude that the next 20 years are going to be completely unlike the last 20 years.
The dotted line in
Figure 10.2
, covering the period from the 1950s to the early 1980s (“Stage One” in the chart), was very nearly flat over those three decades but then adopted an entirely new and steeper trajectory beginning in the early 1980s (“Stage Two”). It is in Stage Two where we can detect the underlying cause of the economic predicament that first revealed itself in 2008. Whether you are talking about an individual, a municipality, a state, or a nation, there must be some reasonable proportionality between one’s debts and one’s income. Stage Two illuminates when, for how long, and to what extent the United States lost its footing.
Figure 10.2
Credit Market Debt to GDP
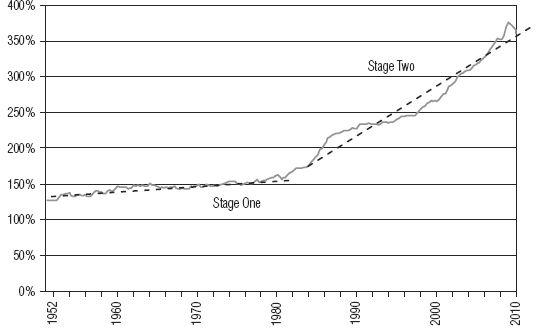
Compares total credit market debt in the United States to GDP (Gross Domestic Product) on a percentage basis. Current total credit-market debt stands at more than 360 percent of total GDP. Notably, this chart excludes all liabilities of the nation. No pension or entitlement shortfalls appear here, as they aren’t technically “debt.”
Sources:
Federal Reserve & Bureau of Economic Analysis.
But that’s the past; what about the future? In order for the four decades that will come after 2010 to economically resemble the four decades that came before, the slope of line in Stage Two must not change. If it flattens out a bit, or, more ominously, returns to the anemic slope seen in Stage One, then the next four decades will have weaker growth, fewer opportunities, and be marked by less wanton indulgence and more cautious purchasing habits. In short, they will not resemble the prior four decades, at all.
A key question you might ask yourself here would be,
How likely is another doubling of debt over the next decade?
My current prediction is
not very
, but that is my own personal assessment. If I were to summarize my view here, I would say that anyone who is counting on, requiring, or otherwise hinging their future sense of prosperity on an uninterrupted continuation of the Stage Two line is making a very low-probability bet. Your assessment may well be different, or perhaps not, but no matter where you fall on the spectrum of possibilities, remember to trust yourself.
Back to the main topic. A simple way to interpret
Figure 10.2
is to simply note that when the solid line is rising, it means that debt is growing faster than GDP (i.e., income). This is analogous to a credit card balance that steadily grows larger even as the income of the cardholder remains the same. It doesn’t take a PhD in economics to understand that sooner or later such a trend will come to a screeching halt. Someday payments on the interest will become too difficult and debt accumulation will cease. The strict math limit to that process occurs when 100 percent of income is required to service the interest payments alone, but thankfully things rarely get that far.
When viewed historically and compared to GDP, the current levels of U.S. debt are unprecedented. There are no maps to guide us in these unknown waters. There’s no history, no institutional memory to draw upon, and no experienced leadership prepared to confidently guide us through such a crisis. That’s my major point here: Anybody who is counting on the past extending seamlessly into the future is headed for almost certain disappointment, both because there’s a very low chance of doubling debts yet again and because there are no experienced leaders with their hands on the wheel.
Of course, with more than a single chart, I can make a far better case that the future will be quite different from the past.
The History of Debt
The first part of this story, historically speaking, always begins with the accumulation of debt. Perhaps there are important wars to fund or an exciting new technology in which to invest (e.g., railroads, Internet, and so on) Or perhaps there’s nothing more to show for the debt accumulation than a period of reckless consumption.
The second part of this story involves the psychology of the players who are fully invested in perpetuating the status quo. There are careers to consider, and small matters of legacy here and there, but mostly there’s an overwhelming desire by the leaders of each generation to conform and not rock the boat.
The circumstance of “too much debt” has been revisited dozens of times throughout history, and the same exact, perfectly understandable, imperfectly human response has been applied nearly every time: printing money.
This Time Is Different
In their landmark work titled
This Time Is Different
, Kenneth Rogoff and Carmen Reinhart
2
assembled a comprehensive database spanning 800 years of economic data including international debt and banking crises, inflation, currency crashes, and debasements. The one constant throughout history is that many governments, for myriad reasons, have gotten themselves wedged into a situation best described as “too much debt.” Throughout history, nearly all governments so stricken by debts have tried to find salvation by wriggling out through the same unworkable portal. In every case, the same rationale has been used as internal justification for official actions:
This time is different
.
Here are a few of the important conclusions from Rogoff and Reinhart’s work:
A recent example of the “this time is different” syndrome is the false belief that domestic debt is a novel feature of the modern financial landscape. We also confirm that crises frequently emanate from the financial centers with transmission through interest rate shocks and commodity price collapses. Thus, the recent U.S. sub-prime financial crisis is hardly unique. Our data also documents other crises that often accompany default: including inflation, exchange rate crashes, banking crises, and currency debasements.
Their work reveals that throughout history, various countries have attempted to live beyond their means and inevitably failed to sustain it for very long. The response has nearly always been to try and squeeze past the difficulties by printing more money in the hopes that somehow things will work themselves out. But it has never quite worked out as hoped; “printing” has only served to deepen the severity of the economic and political pain. Yet it has been tried again and again, as if there’s some biologically irrelevant human gene that stimulates the desire to print money while suppressing the ability to learn from history.
The work of Rogoff and Reinhardt demonstrates that historically, some form of default always follows the condition of “too much debt,” and currency debasement (known as “money printing” in modern times) is the most common form that this default takes. Along with these defaults, banking crises, exchange-rate volatility, crashes, inflation, and political and social unrest often arise.
The most important finding from the Rogoff and Reinhart study is that periods of relative global financial tranquility have always been followed by waves of defaults and restructurings. Ebb and flow are a normal part of economic history. In this light, we might then view the last four decades of debt accumulation as the calm before the storm, rather than the last few steps of a long march toward a final and lasting equilibrium.
The important points to take away here are these: Country-level debt defaults are historically common and economically painful events that typically arise from the condition of too much debt, and the four most dangerous words in economic history are
this time it’s different
.
