The Crash Course: The Unsustainable Future of Our Economy, Energy, and Environment (17 page)
Read The Crash Course: The Unsustainable Future of Our Economy, Energy, and Environment Online
Authors: Chris Martenson
Tags: #General, #Economic Conditions, #Business & Economics, #Economics, #Development, #Forecasting, #Sustainable Development, #Economic Development, #Economic Forecasting - United States, #United States, #Sustainable Development - United States, #Economic Forecasting, #United States - Economic Conditions - 2009

Figure 12.1
The Federal Reserve Balance Sheet
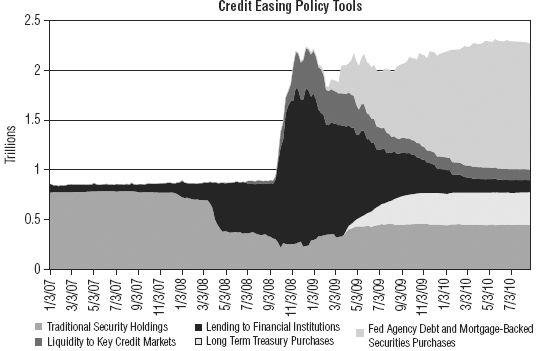
The slow and careful accumulation of assets (debts) turned sharply upward at the start of the credit crisis in 2008.
Source
: Cleveland Federal Reserve.
How does this practice differ from the historical practice of clipping coins or printing money directly? Essentially, it doesn’t, except under the theory that the Federal Reserve can reverse the transactions as rapidly as they entered them, thereby unwinding them and hopefully “sterilizing” the inflationary impacts when they begin to surface. In theory, the kings that clipped their coins could also have recalled them all, melted them down, and reminted larger versions, but that never happened, so history suggests that the expansion of the Fed balance sheet will be permanent.
In reality, putting money
into
the system is far easier than taking it back
out
. When the Fed puts the money into the system, an institution delivers a (possibly flawed) debt instrument to the Fed and receives a large pile of cash in return. Reversing this process requires that an institution have a large and ready pile of cash on hand to give to the Fed in exchange for the (possibly flawed) debt. Cash is rarely left piled up at financial institutions; it is generally put to work quite rapidly when it’s received, so raising cash usually requires selling other things elsewhere. For this reason, putting cash out into the marketplace is a lot easier for the Fed than reeling it back in. If they don’t (or can’t) reverse these monetary injections, then there’s an incredibly high chance of destructive inflation emerging at some point in the future.
The point of raising the issue of QE here is simply to illustrate that money printing isn’t some future event for which we need to maintain some level of vigilance. It’s already happening. As Rogoff and Reinhardt have shown, printing is the first refuge of cornered officials, and those serving today have proven to be no different from those in the past. History may not necessarily repeat, but it does often rhyme.
This means that we can expect large quantities of money to be printed in an effort to forestall the inevitable pain of past decisions—decisions that revolved around not only taking on too much debt, but fashioning the bulk of our economy around its perpetual expansion. It means that if there are other structural reasons for why the economy is not growing as expected or intended, such as resource limitations, we can expect the Fed to deal with that predicament by applying the same ‘solution’ they’ve always used in the past: money printing. When all you have is a hammer, everything looks like a nail.
I want you to hold that idea in the back of your mind until we get to Chapter 15 (
Energy and the Economy
), where we’ll assess whether there are any additional dark spots on the horizon to further cloud up the story of endless economic growth.
1
On August 15, 1971, President Richard Nixon “slammed the gold window,” ending the Bretton Woods I agreement, which allowed foreign countries to convert their paper dollar holdings into U.S.-held gold at the fixed price of $35 per ounce. From that moment on, foreign exchange rates lost their anchor to gold and “floated” freely on the international market.
CHAPTER 13
Fuzzy Numbers
What if it’s true, as author Kevin Phillips states, that “[e]ver since the 1960s, Washington has gulled its citizens and creditors by debasing official statistics, the vital instruments with which the vigor and muscle of the American economy are measured.”
1
What if it turns out that our individual, corporate, and government decision making was based on deeply misleading, if not provably false, data?
That’s what we’re going to examine here, uncovering the ways that inflation and Gross Domestic Product, or GDP, are measured, or as we might say,
mis
measured.
Inflation is an active policy goal of the Federal Reserve,
2
and for good reason: Too little inflation, and our current banking system risks failure; too much and the majority of people noticeably lose their savings, which makes them angry and politically restive. So keeping inflation at a “Goldilocks” temperature—not too hot and not too cold—is the name of the game.
Inflation results from a mixture of two components. The first is simple pressure on prices due to too much money floating around. If goods and services remain constant but circulating money rises, inflation will result. The second component lies with people’s expectations of future inflation. If people expect prices to rise, they tend to spend their money now, while the getting is still good, and this serves to fuel further inflation in a self-reinforcing manner. The faster people spend, the more they expect inflation to rise, and the more inflation does rise. Zimbabwe was a textbook-perfect example of this dynamic in play during the years 2001 to 2008, when inflation nudged over 100 percent on its way to a peak of more than 230 million percent.
3
On the other hand, if expectations are that inflation will be tame, they’re said to be “well-anchored.”
Accordingly, official inflation policy has two components. The first is goosing the money supply to just the right level to achieve the desired amount of inflation, and the second is anchoring your expectations to help keep inflation in check. Assuming both components can be controlled, how exactly is “anchoring” accomplished? You might be surprised at the answer. Over time, the management of your inflation expectations has evolved into little more than reporting inflation to be lower than it actually is.
The details of how this is done are somewhat complicated, but they’re worthy of your attention because trusting bad data can be hazardous to your wealth. Before we begin, I’d like to be clear on one point: The tricks and subversions that we’ll examine did not arise with any particular administration or political party. Rather, they arose incrementally during each administration from the 1960s onward. If I point fingers, I’ll be pointing at actions, not ideologies. There are plenty of examples that were implemented by both of the major U.S. political parties, and there’s absolutely no partisan slant to this game.
Administrative Bias
Under President Kennedy, who disliked high unemployment numbers, a new classification was developed that scrubbed so-called discouraged workers from the statistics, which had the effect of causing headline-data unemployment figures to drop. Discouraged workers, defined as people who desire to work but aren’t currently looking due to poor employment prospects, weren’t counted; the unemployment numbers that we reported to ourselves went down, and Kennedy was reported to be pleased with the outcome. Of course, the exact same number of people were unemployed both before and after this statistical revision, but the number went down, so things looked better. No president since has seen fit to discontinue this practice, so “discouraged workers” are still dropped from the counted rolls.
President Johnson created the “unified budget” accounting fiction that we currently enjoy, which rolls Social Security surpluses into the general budget, where they are spent just like ordinary revenue. Even though the surplus Social Security funds have been spent and thus represent a debt of the U.S. government, budget deficits are reported after taking into account the positive impact of the “donated” Social Security money (which reduces the cash deficit) but not the future negative impact of this borrowing. In this sense, the federal budget deficits that you read about are fiction.
President Nixon bequeathed us the so-called core inflation measure, which strips out food and fuel, to create a measure of inflation “ex food and fuel,” which financial commentator Barry Ritholtz says is “like reporting inflation ex-inflation.” For the rest of us, it’s very strange to think about inflation as consisting of the prices of our essential daily needs minus the eating, driving, and heating parts.
By adopting the Boskin Commission recommendation on inflation, President Clinton bestowed upon us the labyrinthine statistical morass that’s now our official method of inflation measurement, which we’ll discuss in detail below.
These are just some examples of a pathological instinct to buff the numbers into a rosier hue that has been a feature of every presidential administration since Kennedy. At every presidential turn, a new way of measuring and reporting was derived that invariably made things seem a bit better than they actually were. I know of no examples where a new economic measure was adopted that served to make things seem a bit drearier or worse off. The process of debasing our official statistics has always been strongly biased. Economic activity was always adjusted higher, inflation was statistically tormented downwards, and jobs were made to seem more plentiful than they actually were.
Unfortunately, the cumulative impact of all this data manipulation is that our measurements no longer match reality. In effect, we’re telling ourselves lies, and these untruths serve to distort our decisions and jeopardize our economic future. A few economic fibs during the good years seemed harmless enough, and they probably were. However, with the current and emerging economic difficulties, we will find them to be as severe a liability as defective cockpit instruments would be to a pilot navigating a gap through the Rockies.
Next let’s discuss in detail the way the most important indicators that we rely on for understanding our economic picture are adjusted, measure-by-measure.
Inflation
We’ll begin with inflation, which is reported to us by the Bureau of Labor Statistics (BLS), in the form of the Consumer Price Index (CPI). If you were to measure inflation, you’d probably track the cost of a basket of goods from one year to the next, subtract the two, and measure the difference. If you did, your method would, in fact, mirror the way inflation was officially measured right on up through the early 1980s. It’s a perfectly logical, defensible, and sensible method.
But in 1996, Clinton implemented the Boskin Commission findings, which championed the use of three new statistical tools—substitution, weighting, and hedonics—that are applied to measured prices after they’re collected but before they’re reported.
The cost of goods and services are no longer simply measured and reported from one year to the next, now that we have adopted the use of the “substitution effect.” Thanks to the Boskin commission, our measurements now assume that when the price of something rises, people will switch to something cheaper. So any time the price of something goes up too rapidly, it’s removed from the basket of goods and a cheaper item is substituted. For example, if rib-eye steaks go up too much in price, they’ll be removed from the basket and replaced (“substituted”) with, say, sirloin steak (or whatever form of steak is the cheapest).
To illustrate the impacts of these statistical tricks, let’s imagine that our goal is to accurately assess whether a group of 20 of our former high school classmates have gained weight (in other words, inflated) or lost weight since high school. Following current government statistical conventions in our experiment, we’d first weigh all 20 subjects and choose the 10 showing the least weight gain, and then we’d extrapolate those findings to the entire group regardless of the greater weight gain shown by the 10 that we did not include. We’d substitute the lowest weight gainers for the highest weight gainers under the theory that people should try to lose weight and should succeed if they try, never mind that this might not have been their goal, just like shoppers who “should” be frugally substituting their favorite foods for cheaper ones regardless of what they actually end up buying.
Using this methodology, the BLS reported that food costs rose 4.9 percent in 2007.
4
However, according to the Farm Bureau, which doesn’t employ these tricks and simply tracks the same shopping basket of the exact same 30 goods from one year to the next, food prices rose 9.2 percent over the past year.
5
That spread of 5.1 percent makes a huge difference. Recall from the “Rule of 70” in Chapter 5 (
Dangerous Exponentials
) that a 5 percent rate of growth will result in a complete doubling in just 14 years. What this means is that even smallish-seeming underreporting of inflation will result in big differences over time. One critique of using substitution as a method is that our measure of inflation is no longer measures the cost of
living
, but rather the cost of
survival
.
The next statistical method, weighting, has the effect of reducing the amount of those goods and services that are rising most rapidly in price, under the assumption that people will use less of those things as prices rise. This is the least defensible of all the statistical tricks, because over time it has deviated widely from reality. For example, the Bureau of Economic Analysis (BEA) reports that health care represents about 17 percent of our total economy, but the BLS only weights it as 6 percent of the CPI. In our high school weight gain example, this would be like only including a fraction of the weight of those who had gained the most, which serves to overcount those who had gained the least or perhaps even lost weight.
Because health care costs have been rising extremely rapidly, reducing health care weighting has had a dramatic reduction in reported inflation. In 2008, if health care had been weighted at a level that matched its true economic proportion, CPI would have been several percentage points higher. CPI weighting leads to undercounting inflation.
Next comes the most outlandish adjustment of them all, one which goes by the name “hedonics,” a name whose Greek roots translate to “for the pleasure of.” This adjustment is supposed to account for quality improvements, especially those that lead to greater enjoyment or utility of a product, which makes some sense, but which has been badly overused.
Here’s an example: Tim LaFleur is a commodity specialist for televisions at the Bureau of Labor Statistics (BLS) where the CPI is calculated. In 2004 he noted that a 27-inch television priced at $329.99 was selling for the same amount as last year but was now equipped with a digital tuner.
6
After taking this subjective improvement into account, he adjusted the price of the TV downwards by $135, concluding that the benefit derived from the tuner improvement was the same as if the price of the TV had fallen by 29 percent. The price reflected in the CPI was not the actual retail store cost of $329.99, which is what it would actually cost you to buy the TV, but $195. Bingo! Based on that adjustment, the BLS concluded that televisions cost a lot less than they used to, and in response, inflation was reported to have gone down. However, at the store you’d discover that these same televisions were still selling for $329.99, not $195.
Another complaint about hedonics is that they’re a one-way trip. If I get a new phone this year and it has some new buttons, the BLS will declare that the price has dropped because of all the additional enjoyment I will receive from using the features attached to those buttons. But if my new phone only lasts 8 months before ceasing to work, instead of lasting 30 years like an old rotary phone, no adjustment will be made for that loss of service life (or the hassle of having to drop everything to go and get a new phone). In short, hedonics rests on the improbable assumption that new features are always beneficial and that these features can be thought of as synonymous with falling prices. I’m not entirely against the practice—I really like the many ways my car is not like a Ford Pinto—but the use of hedonics can easily be overdone, and that’s my estimation of the present situation.
Over the years, the BLS has expanded the use of hedonic adjustments and now applies these adjustments to everything: DVDs, automobiles, washers, dryers, refrigerators, and even college textbooks. Hedonics now adjusts as much as 46 percent of the total CPI, and if recent plans to apply hedonics to health care are approved, this percentage will jump to well over half.
What would happen if you were to strip out all the fuzzy statistical manipulations and calculate inflation the way we used to do it? Luckily, John Williams of
shadowstats.com
has done exactly that, painstakingly following these statistical modifications over time and reversing their effects.
7
If inflation were calculated today the exact same way that it was in the early 1980s, Mr. Williams has determined that it would be roughly 8 percentage points higher than currently reported, which is an enormous difference.