The Crash Course: The Unsustainable Future of Our Economy, Energy, and Environment (7 page)
Read The Crash Course: The Unsustainable Future of Our Economy, Energy, and Environment Online
Authors: Chris Martenson
Tags: #General, #Economic Conditions, #Business & Economics, #Economics, #Development, #Forecasting, #Sustainable Development, #Economic Development, #Economic Forecasting - United States, #United States, #Sustainable Development - United States, #Economic Forecasting, #United States - Economic Conditions - 2009

Figure 5.3
World Population
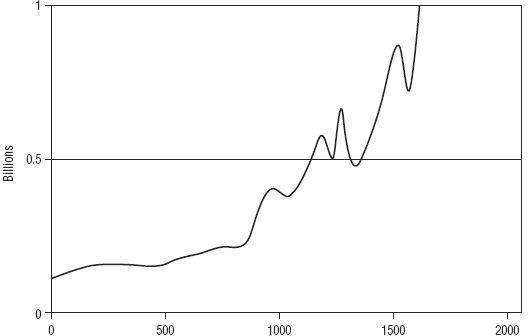
Same world population chart as
Figure 5.2
, but with left axis set at one billion.
Source:
U.S. Census Bureau Historical Estimates.
Similarly, if we scale our left axis to, say, one trillion (
Figure 5.4
), the corner disappears entirely and the entire line becomes flat. We can’t see its curve anymore. But it is still there; it has just been suppressed by our management of the left axis. No more population problem! Right?
Figure 5.4
World Population

Same world population chart as
Figure 5.2
, but expressed in trillions.
Source:
U.S. Census Bureau Historical Estimates.
So the turn-the-corner moment is really just a product of how we draw our chart. Does it mean that the turn-the-corner stage is a worthless artifact and that we can forget all about it? No, far from it. It is very real and vitally important. Let me explain why.
Where the turn-the-corner stage becomes enormously meaningful and important is when you can reasonably set a boundary—that is,
fix
the left axis to a defined limit—because you know how much of something you have. When you do this, the shape of the chart tells you important things about how much time you have left and what the future will hold. For example, if we were studying yeast growth, we might start with a flask that holds one liter of grape juice, a quantity that we already know can only support so many yeast cells. With this defined limit, we can accurately calculate when an introduced population of yeast will crest and then crash.
Similarly, if we happen to know the carrying capacity of the earth for human beings, then we can “fix the left axis” and make some important observations about what the future might bring and how much time remains to stabilize things. Without fossil fuels to assist with agricultural production, the total carrying capacity of the earth for humans is thought to be somewhat less than the current 6.8 billion and possibly as low as one billion.
4
Even if these carrying-capacity calculations prove to be pessimistic and we could set the left axis for sustainable human population at 10 billion (although I’ve not read any scientific analyses that would support such a number), we would still discover that population has turned the corner and that we’re no longer on the flat portion of the curve but the steep portion. This means that you and I happen to live in a very different world with entirely different challenges and opportunities than the people who came before us. We live at a time when most people alive will hopefully witness the transition of human population from exponentially expanding to “not growing.” I say hopefully, because the alternative is to overshoot and collapse, just like our friends, the yeast in the flask.
Speeding Up
A critical concept that I want you to take away from this discussion about exponential growth is that of “speeding up.”
It doesn’t matter how you prefer to approach this concept. You can either think of speeding up in terms of how the amounts accelerate in size over each unit of time,
or
you can think about how the amount of time shrinks between each fixed amount that is added. It’s more stuff with each unit of time or less time between each unit of stuff. Either way you prefer to think of it, you’ll come away with a sense of speeding up.
To illustrate this idea using population, if we started with one million people on the planet and set their growth rate to a relatively tame rate of 1 percent per year (it is actually higher than that), we would find that it would take 694 years for world population to grow from one million to one billion people.
Figure 5.5 Population Growth Example

Note how time “speeds up” by shrinking between each new billion people added to the total population.
But we would reach a world population of 2 billion people after only 100 more years, while the third billion would require just 41 more years. Then 29 years, then 22, and then finally only 18 years, to bring us to a total of 6 billion people. Each additional billion-people mark on our graph took a shorter and shorter amount of time to achieve. The time between each billion shrank each time, meaning that each billion came sooner and sooner, faster and faster. That’s what I mean by speeding up.
Speeding up is a critical feature of exponential growth—things just go faster and faster, especially toward the end.
Making It Real
Using an example loosely adapted from a magnificent paper by Dr. Albert Bartlett,
5
let me illustrate the power of compounding for you.
Suppose I had a magic eye dropper and I placed a single drop of water in the middle of your left hand. The magic part is that this drop of water will double in size every minute. At first nothing seems to be happening, but by the end of a minute, that tiny drop is now the size of two tiny drops. After another minute, you now have a little pool of water sitting in your hand that is slightly smaller in diameter than a dime. After six minutes, you have a blob of water that would fill a thimble.
Now imagine that you’re in the largest stadium you’ve ever seen or been in—perhaps Fenway Park, the Astrodome, or Wembley Stadium. Suppose we take our magic eye dropper to that enormous structure, and right at 12:00 pm in the afternoon, we place a magic drop way down in the middle of the field.
To make this even more interesting, suppose that the park is watertight and that you’re handcuffed to one of the very highest bleacher seats. My question to you is this:
How long do you have to escape from the handcuffs?
When would the park be completely filled? Do you have days? Weeks? Months? Years? How long before the park is overflowing?
The answer is this: You have until exactly 12:50 pm
on that same day
—just 50 minutes—to figure out how you’re going to escape from your handcuffs. In only 50 minutes, our modest little drop of water has managed to completely fill the stadium. But wait, you say, how can I be sure which stadium you picked? Perhaps the one you picked is 100 percent larger than the one I used to calculate this example (Fenway Park). Wouldn’t that completely change the answer? Yes, it would—by one minute. Every minute, our magic water doubles, so even if your selected stadium happens to be 100 percent larger or 50 percent smaller than the one I used to calculate these answers, the outcome only shifts by a single minute.
Now let me ask you a far more important question:
At what time of the day would your stadium still be 97 percent empty space (and how many of you would realize the severity of your predicament)?
Take a guess.
The answer is that at 12:45 pm—only five minutes earlier—your park is only 3 percent full of water and 97 percent remains free of water. If at 12:45, you were still handcuffed to your bleacher seat patiently waiting for help to arrive, confident that plenty of time remained because the field was only covered with about 5 feet of water, you would actually have been in a very dire situation.
And that right there illustrates one of the key features of compound growth and one of the principal things that I want you take away from this chapter. With exponential growth in a fixed container, events progress much more rapidly toward the end than they do at the beginning. We sat in our seats for 45 minutes and nothing much seemed to be happening. But then, over the course of five minutes—whoosh!—the whole place was full of water. Forty-five minutes to fill 3 percent; only five more minutes to fill the remaining 97 percent. It took every year of human history from the dawn of time until 1960 to reach a world population of 3 billion people, and only 40 additional years to add the next 3 billion people.
With this understanding, you will begin to understand the urgency I feel—there’s simply not a lot of maneuvering room once you hop on the vertical portion of a compound graph. Time gets short.
Surrounded by Exponentials
Dr. Albert Bartlett once said that “. . . the greatest shortcoming of the human race is the inability to understand the exponential function.”
6
He is absolutely right. We are literally surrounded by examples of exponential growth that we have created for ourselves, yet very few people recognize this or understand the implications. You now know one implication: speeding up.
Figure 5.6
shows total global energy consumption over the past 200 years. It is plainly obvious that energy use has been growing nonlinearly; the line on the chart looks like one of our hockey sticks. Can energy consumption grow exponentially forever, or is there some sort of a limit, a defined capacity to the energy stadium, that would cause us to fix the left axis on this chart?
Figure 5.6
Total Energy Consumption

This chart includes energy from all sources: hydrocarbons, nuclear, biomass, and hydroelectric.
Source:
Vaclav Smil, Energy Transitions.