The End of Growth: Adapting to Our New Economic Reality (29 page)
Read The End of Growth: Adapting to Our New Economic Reality Online
Authors: Richard Heinberg
Tags: #BUS072000

Electricity is a relatively expensive form of energy but it is very convenient to use (try running your computer directly on coal!). Electricity can be delivered to wall outlets in billions of rooms throughout the world, enabling consumers easily to operate a fantastic array of gadgets, from toasters and blenders to iPad chargers. With electricity, factory owners can run computerized monitoring devices that maximize the efficiency of automated assembly lines. Further, electric motors can be highly efficient at translating energy into work. Compared to other energy sources, electricity gives us more economic bang for each Btu expended (for stationary as opposed to mobile applications).
As a result of technology developments and changes in energy prices, the US and several other industrial nations have altered the ways they have used primary fuels over the past few decades. And, as several studies during this period have confirmed, once the relationship between GDP growth and energy consumption is corrected for energy quality, much of the historic evidence for energy-economy decoupling disappears.
19
The Divisia index is a method for aggregating heat equivalents by their relative prices, and Figure 40 charts US GDP, Divisia-corrected energy consumption, and non-corrected energy consumption. According to Cutler Cleveland of the Center for Energy and Environmental Studies at Boston University, “This quality-corrected measure of energy use shows a much stronger connection with GDP [than non-corrected measures].
This visual observation is corroborated by econometric analysis that confirms a strong connection between energy use and GDP when energy quality is accounted for.”
20
Cleveland notes that, “Declines in the energy/GDP ratio are associated with the general shift from coal to oil, gas, and primary electricity.” This holds true for many countries Cleveland and colleagues have examined.
21
His conclusion is highly relevant to our discussion of Peak Oil and energy substitution: “The manner in which these improvements have been... achieved should give pause for thought. If decoupling is largely illusory, any rise in the cost of producing high quality energy vectors could have important economic impacts.... If the substitution process cannot continue, further reductions in the E/GDP ratio would slow.”
22
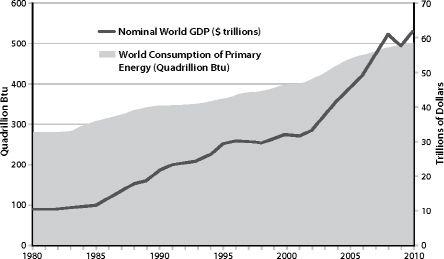
FIGURE 39.
World Energy Use and GDP.
Sources: US Energy Information Administration, International Monetary Fund.
Another often-ignored factor skewing the energy-GDP relationship is outsourcing of production. In the 1950s, the US was an industrial powerhouse, exporting manufactured products to the rest of the world. By the 1970s, Japan was becoming the world’s leading manufacturer of a wide array of electronic consumer goods, and in the 1990s China became the source for an even larger basket of products, ranging from building materials to children’s toys. By 2005, the US was importing a substantial proportion of its non-food consumer goods from China, running an average trade deficit with that country of close to $17 billion per month.
23
In effect, China was burning its coal to make America’s consumer goods. The US derived domestic GDP growth from this commerce as Walmart sold mountains of cheap products to eager shoppers, while China expended most of the Btus. The American economy grew without using as much energy —
in America
— as it would have if those goods had been manufactured domestically.
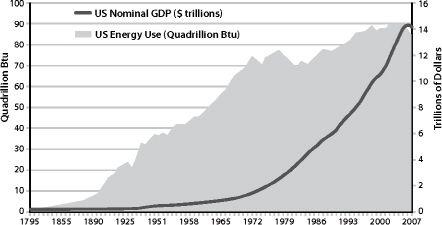
FIGURE 40A.
Energy Use and Economic Growth in the United States, 1795–2009.
Sources: US Energy Information Agency, US Bureau of Economic Analysis, Louis Johnston and Samuel H. Williamson, "What Was the US GDP Then?" MeasuringWorth, 2010.
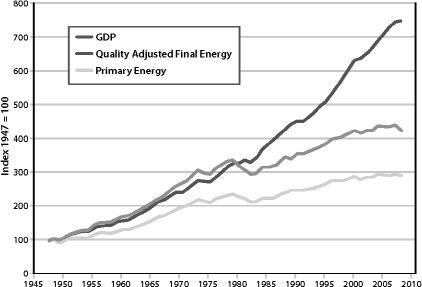
FIGURE 40B.
Decoupling GDP and Energy Use in the US.
Changes in energy quality account for much of the divergence between energy consumption and GDP since 1980. Other factors include outsourcing of production and financialization of the economy. Sources: US Energy Information Administration and Bureau of Economic Analysis; Cutler Cleveland, Encyclopedia of Earth.
There is one more factor that helps explain historic US “decoupling” of GDP growth from growth in energy consumption — the “financialization” of the economy (discussed in Chapter 2). Cutler Cleveland notes, “A dollar’s worth of steel requires 93,000 BTU to produce in the United States; a dollar’s worth of financial services uses 9,500 BTU.”
24
As the US has concentrated less on manufacturing and building infrastructure, and more on lending and investing, GDP has increased with a minimum of energy consumption growth. While the statistics seem to show that we are becoming more energy efficient as a nation, to the degree that this efficiency is based on blowing credit bubbles it doesn’t have much of a future. As we saw in Chapter 2, there are limits to debt.
The actual tightness of the relationship between energy use and GDP is illustrated in the recent research of Charles Hall and David Murphy at the State University of New York at Syracuse, which shows that, since 1970, high oil prices have been strongly correlated with recessions, and low oil prices with economic expansion. Recession tends to hit when oil prices reach an inflation-adjusted range of $80 to $85 a barrel, or when the aggregate cost of oil for the nation equals 5.5 percent of GDP.
25
If America had truly decoupled its energy use from GDP growth, then there wouldn’t be such a strong correlation, and high energy prices would be a matter of little concern.
So far we’ve been considering a certain kind of energy efficiency — energy consumed per unit of GDP. But energy efficiency is more commonly thought of more narrowly as the efficiency by which energy is transformed into work. This kind of energy efficiency can be achieved in innumerable ways and instances throughout society, and it is almost invariably a very good thing. Sometimes, however, unrealistic claims are made for our potential to use energy efficiency to boost economic growth.
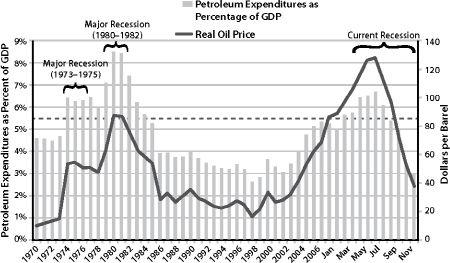
FIGURE 41A.
From Hall and Murphy.
The dotted line represents a threshold for petroleum expenditure as a percentage of GDP. When expenditures rise above this line, the economy begins to move towards recession. Distillate fuel oil, motor gasoline, LPG, and jet fuel are all included in petroleum expenditures. Source: Adapted from David J. Murphy and Charles A. S. Hall, 2011. “Energy return on investment, peak oil, and the end of economic growth” in Ecological Economics Reviews. Robert Costanza, Karin Limburg & Ida Kubiszewski, Eds. Ann. N. Y. Acad. Sci. 1219:52–72.
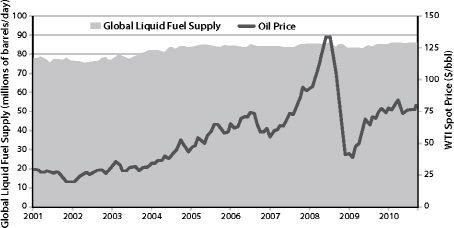
FIGURE 41B.
Liquid Fuel — Supply vs. Price.
Source: US Energy Information Administration.
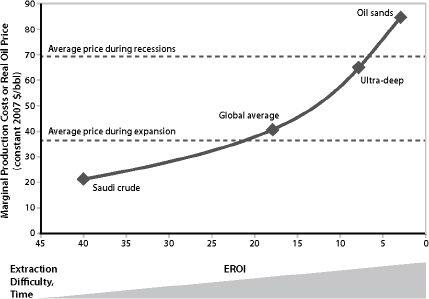
FIGURE 41C.
Oil Production Costs from Various Sources as a Function of Energy
Returned on Energy Invested (EROI).
The dotted lines represent the real oil price averaged over both recessions and expansions during the period from 1970 through 2008. EROI data for oil sands come from Murphy and Hall, the EROI values for both Saudi Crude and ultradeep water were interpolated from other EROI data in Murphy and Hall, data on the EROI of average global oil production are from Gagnon et al., and the data on the cost of production come from Cambridge Energy Research Associates. Source: Adapted from David J. Murphy and Charles A. S. Hall. 2011. “Energy return on investment, peak oil, and the end of economic growth” in “Ecological Economics Reviews.” Robert Costanza, Karin Limburg & Ida Kubiszewski, Eds. Ann. N. Y. Acad. Sci. 1219:52–72.
Since the 1970s, Amory Lovins of Rocky Mountain Institute has been advocating doing more with less and has demonstrated ingenious and inspiring ways to boost energy efficiency. His 1998 book
Factor Four
argued that the US could simultaneously double its total energy efficiency and halve resource use.
26
More recently, he has upped the ante with “Factor 10” — the goal of maintaining current productivity while using only ten percent of the resources.
27
