Understanding Sabermetrics (26 page)
Read Understanding Sabermetrics Online
Authors: Gabriel B. Costa,Michael R. Huber,John T. Saccoma

Was Ruth a better slugger than Cobb was a hitter? Maybe we can compare apples and oranges.
As mentioned above (and in Inning 7), it is extremely difficult to compare players from different eras. We can attempt to use normalization and relativity arguments. We have just used a hitting example, so now we try something in pitching.
Hugh Ignatius “One Arm” Daily played his first professional game for the Buffalo Bisons in 1882 at the age of 34. He would play baseball for six seasons, primarily as a pitcher, spending each season with a different team (Buffalo in 1882, the Cleveland Blues in 1883, Chicago/Pittsburgh and then the Washington Nationals in the Union League in 1884, the St. Louis Maroons of the NL in 1885, the Nationals again in 1886, and the Blues again in 1887. His career record was 73-87. So what? In 1884, he struck out 483 batters in 500⅔ innings pitched, enroute to a 28-28 record. This strikeout total ranks third all-time for a season. His single-season strikeouts-per-nine-innings-pitched (K/9IP) ratio was 8.682. This mark stood for 71 years, until Herb Score came along in 1955. That year, Score was voted Rookie of the Year with the Cleveland Indians, and he struck out 245 batters in 227⅓ innings (K/9IP = 9.699), sporting a 16-10 record. Score’s achievement only lasted until 1960, when the Los Angeles Dodgers’ Sandy Koufax struck out 197 men in 175 innings, giving him a K/9IP of 10.131. Koufax broke his own record in 1962 (remember, after league expansion), with 216 K in 184⅓ innings (K/9IP = 10.546), and he finished that season with a 14-7 showing. The record came back to Cleveland when Sudden Sam McDowell set a new mark of K/9IP = 10.714 (325 K in 273 IP) in 1965; McDowell’s feat stood until 1984 when another Rookie of the Year, the Mets’ Dwight “Doc” Gooden, notched 276 K in 218 IP (K/9IP = 11.394). Nolan Ryan bested that three years later, posting K/9IP = 11.480 (270 / 211⅔), at the age of 40, going 8-16 for the Houston Astros. Seattle’s Randy Johnson broke the 12 K/9IP level, the Cubs’ Kerry Wood (in his 1998 Rookie of the Year season) beat Johnson, Boston’s Pedro Martinez topped 13 K/9IP in 1999, and Randy Johnson again set a new record of 13.410 K/9IP (372 strikeouts in 249⅔ innings) in a season in which he won 21 games and was named World Series Most Valuable Player.
How can we rate the significance of each pitcher? Hugh Daily’s 483 strikeouts will probably never be bested. Some of the pitchers on the list had dismal win-loss records yet managed to have a high frequency of strikeouts when they were in a game. By 1903, Rube Waddell had the career mark of just over 7 strikeouts per 9 innings. Bob Feller overtook him for a while but then tailed off toward the end of his career, giving the record back to Waddell. Sandy Koufax and Nolan Ryan also held the career ratio record until Randy Johnson grabbed it in 1994, and Johnson has held it ever since. The Big Unit’s career mark was as high as 11.207 in 2002 but had dropped to 10.776 at the end of the 2006 season.
Are we comparing apples to oranges in this case? Should we bring in the normalization factor and compare each of the single-season marks to the league average? Probably so, as the only pitchers to record more than 350 strikeouts in a single season who did
not
pitch in the 1800s are Sandy Koufax (1965), Nolan Ryan (1973 and 1974) and Randy Johnson (1999 and 2001). Interestingly, Koufax pitched 335⅔ innings in 1965; that’s when Sam McDowell set the K/9IP record.
not
pitch in the 1800s are Sandy Koufax (1965), Nolan Ryan (1973 and 1974) and Randy Johnson (1999 and 2001). Interestingly, Koufax pitched 335⅔ innings in 1965; that’s when Sam McDowell set the K/9IP record.
Is anyone interested in strikeouts per nine innings pitched? Sure. However, one of the questions we must ask is does the instrument reveal something? What are the shortcomings of trying to compare players from vastly different eras with this statistic? Should we try to use it for different eras? Since expansion in the mid-1990s, many experts feel that offense has taken over the game of baseball. Home runs are flying out of the park. The ball is juiced. Pitching is diluted. Perhaps a significant pitching statistic, such as K/9IP, which shows improvement in recent years, will give those experts something else to ponder.
Now, it’s time for a few examples of using sabermetrics. We will discuss examples of using measures to study batting, pitching, fielding, and team performance. First, let’s talk about hitting.
If we know a player’s batting average and slugging average, we can use a new statistic called Isolated Power (ISO), which was an outgrowth of studies done by Branch Rickey and Allen Roth in the 1940s and 1950s. Its formula is ISO = SLG - BA and it essentially takes the singles out of a player’s batting average to measure power hitting. Since first base is often a source of power in a team’s lineup, let’s apply the statistic there. Say, for example, we wanted to determine which was the better offensive first baseman from the past, Hall of Famer George Sisler of the St. Louis Browns or Brooklyn Dodger Gil Hodges. Sisler had a career BA of .340 (2812 H / 8267 AB), one of the top 15 of all time, and a career SLG of .468. Gil Hodges, on the other hand, had a career BA of .273 (1921 H / 7030 AB) and career SLG of .487 (3422 TB / 7030 AB). While Sisler’s raw numbers seems superior, their ISO numbers tell a different story. His ISO is .128, while Hodges’ is .214. Now wait a minute, you might argue. Isn’t Sisler is being penalized for having such a lofty career average? After all, he outhit Hodges. That may be a valid point. So, when we look at their respective OPS and SLOB, the result is at least mildly surprising. Hodges had an OBA of .359, while Sisler had a .376. Thus, their respective SLOB and OPS are .176 and .844 for Sisler and .175 and .844 for Hodges, numbers that indicate that it’s a dead heat.
How does Greg Maddux stack up against the greatest pitchers of all time? Consider the following statistical lines for Maddux and Hall of Famer Sandy Koufax:
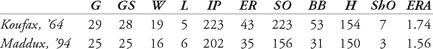
The years seem pretty equal, but Koufax had more innings pitched and more strikeouts, and Maddux was 20 points better in Earned Run Average. How can you compare two pitchers that faced different batters in different eras?
In 1964, the National League’s aggregate ERA was 3.54. If one were to divide the league ERA by Koufax’s, we obtain a statistic that sabermetrician Pete Palmer termed the relative ERA. Koufax’s relative ERA for 1964 was 3.54 / 1.74 = 2.03, indicating that Koufax was about twice as good as the average pitcher that year. Maddux’s 1994 ERA of 1.56 was attained in a season that the National League’s ERA was 4.21, making his Relative ERA 4.21 / 1.56 = 2.70. By this measure, one could make the argument that Maddux’s season was significantly better than that of Koufax.
One of the most difficult aspects of baseball to quantify is defense. While Fielding Percentage had long been the standard by which defense was calibrated, James introduced a statistic called range factor which gives additional insight. Consider the 1955 season; New York Giant immortal Willie Mays played 152 games and had 407 outfield putouts, 23 assists and made 8 errors. His fielding percentage, (PO + AS) / (PO + AS + E) = .982. Larry Doby, then of the Chicago White Sox, played 129 games and had 313 putouts, 6 assists and 2 errors, for a fielding percentage of .994. Doby might have been judged the better fielder; however, range factor, which measures successful chances per game (ignoring errors), favors Mays. His range factor in 1955 was (PO + AS) / G, or (407 + 23) / 152 = 2.83, while Doby’s was (313 + 6) / 129 = 2.47. The difference in their Range Factors was .36, which may not seem like much, but translates to 36 more successful chances in just 100 games.
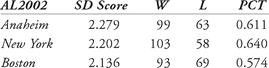
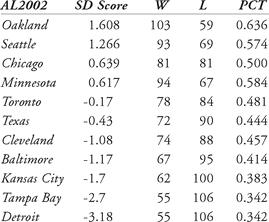
Sabermetrician and noted author Rob Neyer has used the standard deviation to create a statistic called the SD score. It is a measure of how far a team’s runs scored and allowed relate to the league average. It is the sum of the number of standard deviations above the league’s mean in runs scored plus the number of standard deviations below the mean in runs allowed. History shows that excellent teams are associated with an SD score above three, average teams score around zero, and poor teams score in the negative numbers. The 1998 New York Yankees had an SD score of 3.81, the best in the 20th century.
The following chart gives the SD scores for the American League in 2002. Using this method, one is less surprised by the World Series victory by the wild card Anaheim Angels. The Oakland Athletics’ early playoff exit is also less surprising, and the managerial effort of Minnesota’s Ron Garden-hire can be better appreciated.
1. Consider all players with at least 500 lifetime home runs. Define the cumulative home run ratio (CHR) as the number of home runs (HR) divided by the number of at-bats (AB) leading up to a particular age. (For example, if Player X hit 5 HR in 100 AB at the age of 20, his CHR = 5/100 = .050. If he hit 10 HR in 100 AB at the age of 21, his CHR now increases to: (5+10)/(100+100) = .075). Compare each player’s CHR with his age for their entire careers.
2. Ken Riordan of Inverness, Florida, has developed a measure he calls the peer ratio. With this instrument, Riordan computes a statistic, say the major league slugging percentage over the span of a particular player’s career, and divides this number into the corresponding career statistic of the player to get his peer ratio. For example, Ted Williams had a slugging average of .634 over a career that spanned from 1939 through 1960. Over the same period, major league batters slugged .381, giving Williams a peer ratio of .634/.391 = 1.664. Discuss the pros and cons of this measure.
Swing and a Miss1. No-hitters have declined in recent years. One of the factors may be the low number of innings that starters pitch. Roy Halliday led the American League with only five complete games in 2005. Compare five pitchers from each league who have had at least 200 innings pitched in the last three seasons. What was the average number of innings per start? What was the average number of hits per inning pitched? Now look at a few of the pitchers who have thrown no-hitters in the past (Nolan Ryan, Sandy Koufax, etc.). What was their ratio of hits per nine innings? Innings per start? What conclusions (if any) can you draw?
Easy Tosses1. Refer back to Inning 4, “Hard Sliders” Problem 3. Which of the six doubles leaders has the highest ISO?
2. In 1968, St. Louis Cardinals ace Bob Gibson posted an ERA of 1.12, causing Major League Baseball to lower the height on the mound the following season. That was the only season in which Gibson led the league in ERA. In 2005, Roger Clemens led the league for the 7th time in ERA, posting a mark of 1.87. Compare their relative ERAs.
3. Cleon Jones and Paul Blair were both signed by the New York Mets in the amateur drafts of 1963 and 1962, respectively. They played against each other in the 1969 World Series, Blair in the Baltimore Orioles outfield and Jones in the Mets outfield. Compare their range factors and fielding percentages. Use a relative argument.
Other books
Chasing Redbird by Sharon Creech
The Black Seas of Infinity by Dan Henk
More than Friends - Monica Murphy by Monica Murphy
Seducing an Angel by Mary Balogh
The Bone Magician by F. E. Higgins
Run the Risk by Scott Frost
A Turbulent Priest by J M Gregson
Vindicated by Keary Taylor
Passionate Bid by Tierney O'Malley
Sleepless Knights by Mark Williams