Understanding Sabermetrics (5 page)
Read Understanding Sabermetrics Online
Authors: Gabriel B. Costa,Michael R. Huber,John T. Saccoma

Let’s calculate the HEQ for various players on the 2006 New York Mets team. First, consider the starting catcher, Paul LoDuca. He was credited with 802 PO, but the formula caps PO for catchers at 800 (catchers are credited with a PO whenever they hold onto the third strike in a strikeout), so he gets 800 PO. He had 59 A, was charged with 11 E, and participated in 4 DP. The PMF for catchers is .445. Thus, his HEQ-D for 2006 is
which is considered a fine defensive season.
(PO + 3 A + 2 DP − 2 E) × 0.445 =
[800 + 3(59) + 2(4) − 2(11)] × 0.445 = 428.5
At first base, Carlos Delgado had 1199 putouts, 70 assists, and participated in 94 double plays while committing 11 errors. The PMF for first basemen is .51, and we remark that, in the HEQ-D formula, only ¼ of the PO are counted, as many of the first baseman’s PO are the result of routine throws from other infielders. Delgado’s HEQ-D is (0.25 PO + 3 A +DP − 2 E) × 0.51 = [0.25(1199) + 3(70) + 94 − 2(11)] × 0.51 = 299.8, which, while not excellent, is in line with his defensive reputation.
In Table 3.3 we provide the HEQ-D for the top Mets starting players at each position.
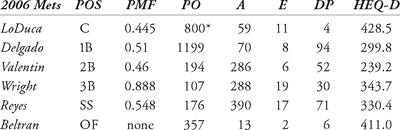
Table 3.3 HEQ-D for the 2006 Mets players
Note that Beltran’s defensive season falls into the “exceptional” category.
What Hoban does next is to add the HEQ-O and the HEQ-D to get a seasonal total. For Carlos Beltran, his offensive numbers for the HEQ-O are as follows:
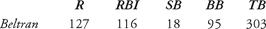
His HEQ-O = TB + R + RBI + SB + 0.5 × BB = 303 + 127 + 116 + 18 + 0.5(95) = 611.5, making his seasonal total HEQ-O + HEQ-D = 411 + 611.5 = 1022.5. This is overall an excellent season. In Hoban’s analysis, the ten best seasons are averaged to obtain the Player Career Total (PCT). Ten seasons are chosen because Hall of Fame candidates need to have played for 10 years. As stated earlier, the average total HEQ for the player’s ten best seasons is called the Player Career Total (PCT). A PCT of at least 830 seems to be a good indicator for Hall of Fame induction.
Table 3.4 Carlos Beltran’s 2006 statistics
To test this indicator or boundary line, let’s consider the career of Gil Hodges, first baseman for the Brooklyn Dodgers, who has received more votes for the Hall of Fame than any player in history, yet he has yet to be voted in as a member. His PCT is 904, based on the sum of his HEQ-O and HEQ-D, rounded to the nearest whole number, for his 10 best seasons:

The PCT values are sorted from highest to lowest for the ten best seasons, which run from 1949 to 1958 consecutively.
Table 3.5 Gil Hodges’ PCT
Another rather simple measure to use and understand is Total Average (TA). Popularized and conceived by Washington Post baseball writer Thomas Boswell, the statistic is essentially a ratio between a player’s bases gained and outs made. In fact, it is similar in form to Barry Codell’s Base-Out-Percentage (BOP). First we provide the formulas, and then we will analyze them:
Total Average = (TB + BB + HBP + SB) / (AB−H+ SH + SF + CS + GIDP)
BOP = (TB + BB + HBP + SB + SH + SF) / (AB−H+ SH + SF + CS + GIDP).
Note that the denominators are precisely the same — the number of outs that can be credited to the batter. The GIDP (Grounded Into Double Play) is counted again because the batter has caused two outs, and one of those is counted in AB - H. The BOP includes the number of sacrifices in the numerator, the base portion, because they always result in a runner advancing a base. Look again at Rickey Henderson’s 1982 season:

Table 3.6 Rickey Henderson’s 1982 offensive statistics
Applying the above formulas, we find that his TA = 1.0249, and his BOP = 1.0294. Note that his BOP is almost identical to his TA, in part because he had no sacrifice bunts and only 2 sacrifice flies.
Boswell asserts that any Total Average over 1.000 is “fantastic” because the player “gets more bases than he makes outs,” while more than .900 indicates star or superstar level, .800 indicates all-star level, and everyday players are clustered in the .700s. Boswell also states that the comparisons work best for players within the same league and the same season, and that the vagaries of offense from era to era are a factor. Only two players who were active during the so-called Deadball Era had career TA over 1.000 (Ty Cobb and Tris Speaker).
To bring the stat into focus, an element of relativity can be introduced. The past league statistics do not always have sacrifice fly (SF) totals available, so they have been left out of the calculation. In 1982, the American League had an aggregate TA = 0.655. The league SF was not available at
Baseball-reference.com
, so it was obtained from the
Stats Inc. All-Time Baseball Sourcebook
. Thus, the player’s TA relative to his league can be computed by taking TA / League TA, which for Rickey Henderson in 1982 was 1.025 / 0.655 = 1.554. This indicates that his TA was about 55 percent better than that of the average player in 1982.
In 1915, Ty Cobb stole 96 bases. Sacrifice flies and grounded into double plays statistics are not available for that season, so they will be eliminated from the TA computation. Here is the raw data:

Table 3.7 Ty Cobb’s 1915 offensive statistics
Cobb’s TA is (TB + BB + HBP + SB) / (AB−H + SH + SF + CS + GIDP) = (274 + 57 + 6 + 96) / (563 − 208 + 9 + 0 + 38 + 0) = 1.077. This is slightly higher than that of Henderson, but when relativity is factored into the equation, the difference is much starker. Here are the numbers for the American League in 1915, with SF and GIDP unavailable:

Table 3.8 American League offensive statistics for 1915
As we know, the Deadball Era was a low time for offense. The 1915 American League Total Average is 0.609 (verify this), and so, for Cobb, (TA) / (League TA) = 1.077 / 0.609 is 1.77, which means that he was 77 percent better than the average American League player in 1915. Thus, while Cobb’s raw Total Average is slightly higher than that of Henderson, put into the context of their respective leagues, Cobb’s season was significantly better.
Easy Tosses1. Through the 2006 season, Barry Bonds had career marks in BA, OBP, and SLG, respectively, of .299, .443, and .608. Calculate his career POP.
2. Ryan Howard and Justin Morneau won their respective league’s Most Valuable Player award in 2006, and Albert Pujols was a strong contender for the National League award. Their numbers were:
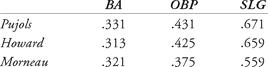
Calculate the POP for each.
Other books
Survive the Dawn by Kate Sweeney
On the Road: (Vagabonds Book 2) (New Adult Rock Star Romance) by Jamison, Jade C.
Imperfectly Perfect by A.E. Woodward
A Taste of Magic (A Sugarcomb Lake Cozy Mystery Book 1) by Alaine Allister
Beware the Orchids (A Shady Acres Mystery Book 1) by Cynthia Hickey
Surrender: Tales of Submission by Eden Bradley
Spoilt by Joanne Ellis
Don't Bet On It by J. L. Salter
La meta by Eliyahu M. Goldratt
What Dies Inside by James Craig