Understanding Sabermetrics (7 page)
Read Understanding Sabermetrics Online
Authors: Gabriel B. Costa,Michael R. Huber,John T. Saccoma

In 1961, however, his offensive numbers improved. He again won the MVP award for the American League, was named to the Sporting News AL All-Star Team, and he was named Major League Player of the Year by the
Sporting News
. His runs scored, hits, home runs, RBI, walks, hit-by-pitch, sacrifice flies, on-base percentage, and slugging percentage were all career highs. Never before, and never again, would his offensive statistics measure up to those of 1961. We could argue that his peak season was in 1961.
Sporting News
. His runs scored, hits, home runs, RBI, walks, hit-by-pitch, sacrifice flies, on-base percentage, and slugging percentage were all career highs. Never before, and never again, would his offensive statistics measure up to those of 1961. We could argue that his peak season was in 1961.
How did that season compare to other sluggers in the American League? We don’t need to go much further than Roger’s own Yankees. Most fans know that Maris was battling Mickey Mantle all season for the home run crown. In 1961, Mantle played in 153 games (eight fewer than Maris). The Mick also scored 132 runs, but he had 163 hits, compared to Rajah’s 159. Mantle hit 54 homers and knocked in 128 runs, but he had 126 walks to lead the league, had 12 stolen bases (to Maris’ zero) and led the AL in slugging with a .687 mark. Finally, Mantle batted .317, second to teammate Elston Howard’s .348. Mantle also hit more home runs in 1960 than Maris (40).
Recall that some of the questions that we strive to answer are: How dominant was the player in his era during these peak years? And was anyone else approximately as dominant in the same or different eras?
During his peak, Maris was a good ballplayer. Perhaps it’s unfair to judge him, as he played on the Yankees, who were always under intense scrutiny. Back to our peak criteria, did the player contribute to his team winning league or world titles in any significant way? In the 1960 World Series, in 25 at-bats, Mantle batted .400 and slugged .800, with three home runs and eleven runs batted in. In 1960, Roger Maris batted .267, slugged .500, with two home runs and two runs batted in in his 30 at-bats. A year later, the new home run king batted .105 in the Series, with one homer and two RBIs, while Mantle batted .167 (recall that he was injured and played in limited duty — two games). Maris had a peak season in 1961, but in comparison to other players and using the criteria outlined above, his peak was not as significant as others in his era.
Eddie Murray gained induction to the Hall of Fame in 2003, after playing 21 seasons and amassing over 11,000 at-bats in 3036 games. The amazing part about Eddie’s career is that he never had a “peak” season; he was consistent throughout his career. He hit 504 home runs and batted in 1917 runs. He had 3255 base hits. His career batting average was .287 and his career slugging percentage was .476. He averaged 27 home runs in a season, but the most he ever hit was 33 in 1983. That was the year the Orioles won the World Series and, incidentally, 33 was Murray’s jersey number. He averaged 103 RBIs per season, yet his highest output was 124 (in 1985). Eddie Murray was voted American League Rookie of the Year in 1977, was voted to only eight All-Star teams, and placed in the top ten in league Most Valuable Player Award voting eight times, never winning (although he did place second in 1982 and 1983). Could it be that Eddie Murray was inducted because his career totals eclipsed the “magic numbers” of 500 home runs and 3000 hits? When Murray retired, he was 15th on the career home run total list. At the end of the 2007 season he was 23rd, and the five players who passed him may not “automatically” be inducted into the Hall of Fame simply on the basis of their more than 500 career homers.
Don Sutton’s record would indicate that he was more valuable over his career than during any peak seasons. The Hall of Fame pitcher won 324 games, yet only broke the seasonal twenty-victory mark once, in 1976 when he had 21 wins. At the end of 2007, Roger Clemens, Greg Maddux and Tom Glavine were the only pitchers who have pitched in the last fifteen years to have won more than 300 career games. Does this suggest that truly great future pitchers will never win 300 games in their career? Except for strike-shortened seasons, someone had always won at least 20 games in a season until 2006, when the National League leader had 16 (six pitchers tied for the league lead) and the American League leader had 19 (two pitchers). The league leaders in games started for the past several seasons are averaging 34 or 35 starts, and not every starting pitcher gets a decision in every game. Further, with today’s specialty pitchers (relievers, one-out match-up pitchers, closers, etc.), starters are averaging fewer than six innings per start and many games are decided after the starter has departed for the showers. So racking up an average of 15 wins in a season for a twenty-year career (15 × 20 = 300) seems to indicate that we might not see a 300-game winner again for a very long time.
Many Hot Stove League conversations are fueled with “Peak versus Career” arguments. For example, who was the more valuable pitcher, Sandy Koufax or Don Sutton?
We have considered the peak versus career value for both hitters and pitchers. We could extend this notion to fielders as well, although most general managers want “complete position players”; GMs want a player who can both field and hit for average. Gone are the days when a player was in the line-up solely for his glove. Hall of Fame manager Earl Weaver once remarked that saving a run is as important as scoring a run, a sentiment that displayed his appreciation of Gold Glove players who might not always hit for power or average (Mark Belanger or Paul Blair). Rod Carew is in the Hall of Fame for his hitting (3053 career hits), yet his 33 errors at second base in 1974 were the most ever by a second baseman since 1946. His fielding percentage was .015 below the league average, but his batting average was .101 above the league mean.
Hitting, pitching, and fielding are individual talents. Can the peak-value analysis be applied to teams? Teams win games by scoring more runs than their opponents. Maybe Weaver’s remark is noteworthy in this regard. At the end of a 154-game or 162-game season, did the team who scored the highest number of runs win the pennant? Or, did the team with the most victories prevail and capture the World Series trophy? Can we use the considerations of Figure 4.1 and apply them to teams? (For more on the relationship of runs scored and runs allowed to wins and losses, see Inning 4: The Linear Weights School — Offense).
The first part of the process is to determine which teams to study. Suppose we look at some teams that have been labeled “dynasties” — those teams that went to the World Series at least three years in a row. Maybe they didn’t win the series all three years, but they played on the big stage for the opportunity. The New York Yankees immediately come to mind (1921-1923, 1936-1939, 1949-1953, 1960-1964, and 1998-2001). Wow! Also, the Chicago Cubs (1906-1908), the New York Giants (1921-1924), the Philadelphia Athletics (1929-1931), the St. Louis Cardinals (1942-1944), the Baltimore Orioles (1969-1971), and the Oakland Athletics (1972-1974 and 1988-1990). Our analysis could determine if these teams exhibited a peak value during their stretch of appearances in the Fall Classic. One drawback of such a study, however, is the homogeneity of the data. In how many cases were the teams fielding the same roster (with the same output) year after year? Were free agents brought into the mix? Were trades a major part of the championship? Perhaps we need to analyze individual teams and compare them to various eras.
In 2004, the Boston Red Sox fielded a powerful offensive team en route to the World Championship. The next year, the Sox brought back much of the same team, yet they failed to win the American League pennant. Should sabermetricians consider 2004 a peak season for Boston, and how does it compare to the peaks of other Boston teams? What measures should we use? Should we limit the study to just the number of victories? The number of runs scored? Runs allowed?
Let’s gather some data (initially look at simple statistics — team batting average and earned run average). We should also take relativity into account, as we compare the Boston Red Sox of 2004 to the 1986 Red Sox, the 1975 Red Sox, the 1946 Red Sox, and the 1918 Red Sox. (Incidentally, the Boston Americans / Red Sox won five World Series titles from 1901 through 1918, the last three with a young left-handed pitching sensation named Ruth). In Table 4.1, we show the BA, ERA, Average Runs Scored (RS) and Average Runs Allowed (RA) for these five Boston teams, as well as the league batting average and ERA (the runs scored and runs allowed averages for the league are the same).
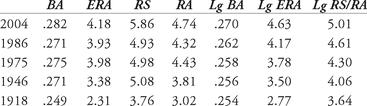
Table 4.1 Boston Red Sox team statistics
Which was the best Boston Red Sox team? Which team had the best peak value? Only the 1918 team had a lower-than-the-league batting average. Obviously, we would need to study more than just team batting average, ERA and runs scored or allowed. Keep in mind that in 1918 and 1946, pitchers’ batting statistics were incorporated into the team average in the American League. Look at the difference between runs scored and runs allowed for the Ted Williams 1946 team. In addition, non-sabermetrical factors might be incorporated. Finally, despite all of the statistics, only the 1918 and 2004 teams brought the championship home to Boston. How does that factor into the analysis? This example should provide an idea of how to conduct a relativity argument for teams. (By the way, where would the 2007 Red Sox fit in?)
An Inside PitchConsider the peak seasons of Barry Bonds, Mark McGwire and Sammy Sosa. Which one of these three sluggers had the best peak value with regard to home runs?
An Outside PitchCompare the career values of the following batting champions: Ty Cobb, Harry Heilmann, Stan Musial and Tony Gwynn.
A Fork BallThe following pitchers have not yet been elected to the Hall of Fame, but each has more than 250 career victories. Compare their career values: Tommy John, Bert Blyleven, Jim Kaat, and Jack Morris.
An Intentional WalkCompare the peak value of the Pittsburgh Pirates teams of 1990, 1991, and 1992. Use the following measures: RS, RA, ERA, BA, OBP, SLG. Which was the best team? These three teams won 96, 98, and 95 games, respectively, easily winning their division. However, all three teams lost in the National League Championship Series. Any ideas why?
Hit and RunIn a 162-game season, does the team that scores the most runs win the pennant? Compare the team peak value for the following teams, given their win-loss record, runs scored, runs allowed, and finish: the 1998 New York Yankees, 2001 Seattle Mariners, and the 2003 Atlanta Braves. What conclusions can you draw?
Inning 3: The Equivalence Coefficient
“What if...?”
This question has fueled baseball discussions for decades. For example, in the 1937 All-Star Game, twenty-seven-year-old Cardinal right-hander Dizzy Dean was hit in the foot by Cleveland outfielder Earl Averill’s line drive, suffering a broken toe. This injury subsequently caused him to alter his pitching motion, and Dean was never the dominant pitching force he had been. What if this had not happened? What would the record book show if Dean’s career had tapered off “naturally”?
Another example can be made by considering the career of Hank Greenberg. The Tiger first baseman was a contemporary of both Jimmie Foxx and Lou Gehrig. (Can you imagine any opposing pitcher facing three more dominant first basemen at any other time in history?) Greenberg drove in 183 runs in 1937 and slugged 58 home runs the following year. He was probably on his way to amassing career numbers which would have approached those of Babe Ruth when in 1941, he appeared in only nineteen games, The next time he suited up was in 1945 when, at the age of 34, he played in 78 games. This was due to the fact that Greenberg responded to the call to serve his country during World War II. One wonders what he would have accomplished had he, like Ted Williams (see below), not missed well over four seasons.
In this chapter we attempt to answer questions related to the two examples just given, by the development of an instrument which we call the
equivalence coefficient
(EC). Before the advent of sabermetrics, individual pitching statistics were pretty much limited to wins versus losses, winning percentage, earned run average and strikeouts. And individual fielding was usually assessed by computing the number of putouts, assists and errors made by a fielder. While this is no longer the case, there were more hitting statistics than those involving pitching and fielding measures in the past, and the same is true
today.
It is because of this that we will begin our discussion with batting.
By the very nature of the game of baseball, a team must score at least one run to win a game. No team has ever won a game by the score of 0-0. Hitting has captured the hearts of many fans throughout the years. Imagine seeing the Flying Dutchman, Honus Wagner, scorching a line drive. Picture Stan Musial slashing a double. Watch as Mickey Mantle reaches the ancient green façade at Yankee Stadium. Recall Willie Mays circling the bases. Remember Hank Aaron completing one of his 755 home runs. Visualize Pete Rose’s single which surpassed Ty Cobb’s lifetime total of hits. Cobb won twelve batting titles in thirteen years. Rogers Hornsby averaged .402 over a five-year stretch. Lou Gehrig slugged twenty-three grand slam home runs.
Other books
Vanity Insanity by Mary Kay Leatherman
The Screaming (Book 1): Dead City by Warwick, Matthew
Prisoner of the Iron Tower by Sarah Ash
Ghosts of the Past by Mark H. Downer
Deadly Seduction (Feral Protectors 3) by Liv Brywood
Más grandes que el amor by Dominique Lapierre
Ellery Queen Mystery Magazine 09/01/12 by Dell Magazines
Inhuman Heritage by Sonnet O'Dell
El día de los trífidos by John Wyndham
Goldie by Ellen Miles