Understanding Sabermetrics (10 page)
Read Understanding Sabermetrics Online
Authors: Gabriel B. Costa,Michael R. Huber,John T. Saccoma

Easy Tosses
1. In his career, Hank Greenberg hit 331 HR in 5193 AB. He also walked 852 times, giving him a PA total of 6045. If Greenberg had 11,000 PA, and if we assume that he would have been 2 percent better for the additional PA, find his EC and project his career HR total.
2. Don Mattingly batted .307 over a 14-year career in which he had 7003 AB while drawing 588 BB. If we assume 12,000 PA, with Mattingly 1 percent better for the additional PA, project his career hit total.
3. Sandy Koufax pitched 2324.3 innings and gave up 713 earned runs. Project his ERA given an additional 1200 IP, assuming that he would have been 4 percent better during the additional IP.
4. J. R. Richards, a first-round draft pick by the Houston Astros, was one of the most feared pitchers of his era in the National League. In his shortened career, he pitched 1606 innings and allowed 562 earned runs. Project his ERA and strikeouts given an additional 1000 innings pitched, assuming he would have been 5 percent better.
Hard Sliders1. Consider the following “split” statistics for Ted Williams:
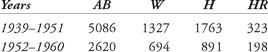
Give Williams an additional 1500 PA during the years 1939-1951 and assume that he was 8 percent better for the additional PA; furthermore, give him an additional 1000 PA for the remainder of his career while assuming that he was 3 percent better. Project his career totals for H, HR and BA.
2. Warren Spahn is considered to be one of the greatest left-handed starting pitchers of all time. He missed three years of playing ball from 1943 through 1945, due to his military service during World War II. Despite that, he still managed to win more games (363) than any other left-handed starting pitcher. Project his win total, given an additional 750 innings pitched, assuming he would have been 5 percent worse (it was the beginning of his career).
Inning 4: The Linear Weights School — Offense
Since the mid-1980s, there has been an explosion of new statistics, many commonly accepted by fans, players, writers, and official scorekeepers. Pete Palmer and John Thorn developed a statistic based on a formula known as “linear weights,” in order to view the numbers of the game “as a means of encapsulating and comprehending experience.” They went on to note that the tendency to scrutinize statistics is truly at the heart of baseball’s hidden game. They recognized that there is an essential relationship between scoring runs and winning games. When the linear-weights model was developed, that relationship was analyzed using raw data in major league baseball’s official records.
As a precursor to Thorn and Palmer’s Linear Weights statistic, we must mention the works of F. C. Lane and George Lindsey. Ferdinand Cole Lane was a biologist who spent 27 years working for
Baseball Magazine
(he was editor from 1912 to 1937), analyzing baseball through statistics that were decades ahead of their time. Well before 1920, Lane conducted a study of exactly 1000 base hits, which occurred in 62 major league games. His goal was to assign a value to each hit and then study the probability of each hit producing a run. He started with a single being one-quarter, a double being one half, etc., and then added a few adjustments for runners on base. After a lengthy study, he developed the run value of a particular hit:
Runs = (0.30 × 1B) + (0.60 × 2B) + (0.90 × 3B) + (1.15 × HR)
A single was worth 30 percent of a run, a double was worth 60 percent of a run, a triple was worth 90 percent of a run, and a home run was worth 115 percent of a run. Lane used his formula to compare various type of hitters: singles hitters versus sluggers, for example. According to his relationship, a double was twice as good as a single, and a triple was three times as good, but a home run was not four times as good as a single (remember, this was the Deadball Era). After several years of continuing this study, Lane changed his coefficients, refining his run production model to:
Runs = (0.457 × 1B) + (0.786 × 2B) + (1.15 × 3B) + (1.55 × HR)
It could have been the arrival of the Longball Era (the emergence of Babe Ruth and other sluggers) which forced the change. Lane also believed that walks contributed to runs, with a run value of 0.164, but this opinion was not shared by many of his contemporaries.
Lane’s work stood alone and quiet for about forty years as a measure for run production. In 1963, George Lindsey published an article in
Operations Research
entitled, “An Investigation of Strategies in Baseball,” in which he was assigned run values to various offensive events, if those events led to scoring runs. For the first half of the twentieth century, the measure of a batter’s effectiveness most used was the batting average (AVG), which is simply the number of hits divided by the number of at-bats. Two other measures were also frequently employed, the slugging percentage (SLG) and runs batted in (RBI). The slugging percentage is the ratio of total bases to the number of official at-bats. For example, in 1911, Ty Cobb had 248 hits in 591 at-bats; his batting average was .420. His hits consisted of 169 singles, 47 doubles, 24 triples, and 8 home runs. This amounted to 367 total bases, which gave him a slugging percentage of .621. He also had 127 RBI. Lindsey, not satisfied with these three measures, conducted a study of the effectiveness of each hit in a game. In particular, Lindsey claimed that a player’s RBI total represented exploits of others (a runner had to be on base, unless the batter hit a home run) in addition to those of the batter. His approach was to assess batting effectiveness based on three assumptions:
• The batter’s ultimate purpose is to cause runs to be scored.
• Batting effectiveness should not be measured for individuals based on situations that faced the batter when he came to the plate (since his batting actions did not create those situations).
• The probability of a batter getting different hits (single, double, etc.) is independent of the situation on the bases.
Lindsey stated that the third assumption listed above was probably not true, but he did acknowledge the perception of clutch hitters “who are particularly successful in critical situations.” He accumulated out-versus-on-base data from 373 major league games played mostly in 1959 and 1960, and determined a value of a hit toward scoring runs based on the 24 different number-of-outs versus occupation-of-the-bases scenarios (no runners on with no outs, runner on first with no outs, bases loaded with two outs, etc.). He used the out-base situation and converted the value of a hit into scoring a run. For example, in computing the value of a double, he found that a batter came to the plate with two outs and runners on first and second in 896 / 27027 = 0.033 appearances, or just over 3 percent of the time. The expected score was 0.403. After the double, the occasion awaiting the next hitter was either two outs and runner on third or two outs and runners at second and third. Lindsey weighted them both equally, and he determined a new expected score of 1.992. He claimed that the value of the double was 1.589 in this scenario, but to obtain the run value for an average situation, he added 0.033 × 1.589 to the terms in the other 23 number-of-outs versus occupation-of-the-bases scenarios. The resulting sum was 0.817, or 0.82 after rounding to two decimal places. He calculated the coefficients for the other hits in a similar fashion. Lindsey’s formula for runs is:
Runs = (0.41 × 1B) + (0.82 × 2B) + (1.06 × 3B) + (1.42 × HR)
Notice that the coefficient for each type of hit is greater if more bases are reached. He explained that a home run increases the expected score, on average, by 1.42 runs. Specifically, a double was worth 1.97 as much as a single, a triple was worth 2.56 times as much as a single, and a home run was worth 3.42 times as much. This would indicate that the current weighting of 1:2:3:4 for slugging percentage overvalues the triple and home run. The key to Lindsey’s research was recognizing that, in calculating the value of a run, a considerable factor was that a player did not make an out. By getting a hit, or, more importantly, not making an out, one batter allowed another batter to get to the plate. To use Lindsey’s formula of batting effectiveness on Ty Cobb, we compute Cobb’s value in runs for the 1911 season: Cobb’s Runs = (0.41 × 169) + (0.82 × 47) + (1.06 × 24) + (1.42 × 8) = 144.63
This means that Ty Cobb produced 144 more runs than the average batter. Wow! Using Lane’s updated model (named the Lane 2), Cobb produced 154 more runs. We could re-compute the slugging percentage with Lindsey’s coefficients as follows:

Lindsey calculated that an average batter has a one-in-three chance of reaching base, thereby allowing another batter to step up to the plate with the same chance to reach base. In his own words, the “allowance for deviation from average performance of the batter at the plate ... can be made by a shrewd manager who knows his players.” This was ground-breaking research into modeling and predicting the runs produced by a hitter, despite Lindsey’s omission of other offensive events, such as walks, steals, caught stealing, sacrifices, etc.
Other researchers have subsequently tried to capture the essence of runs and wins. Steve Mann created the run productivity average (RPA), but it placed too much emphasis on runs batted in (RBI). Mann assigned values based on a study of 12,000 plate appearances. His formula was:

This formula was developed with values concerned with the number of runs and RBIs that each offensive event produced. The drawback in this is that an RBI is credited to the batter who drives in the run and it doesn’t matter how the runner who scored came around the bases to do so. John Thorn and Pete Palmer posed the following scenario to consider: Suppose the leadoff hitter in an inning reaches on an error. The next batter doubles, allowing the runner on first to advance to third base. The third batter of the inning grounds out to an infielder, whose only play is at first base. The batter, who just made an out, is credited with a run batted in. The runner who reached on an error is credited with a run. The second batter who reached via an actual hit (in fact, the only batter to hit safely) is given no credit at all.
In 1978, in an effort to understand the value of a run produced, Pete Palmer developed a computer simulation, taking into account all major league games played since 1901. His goal was to equate measured quantities to actual statistics from league play and model run production. His simulation provided run values of each event in terms of net runs produced above the average amount. If an event was unmeasured, such as the probability of a player advancing an extra base (say, going from first to third on a single, instead of just advancing to second), then Palmer assigned a value to that probability. These additionally assigned values were based on Palmer’s in-depth play-by-play analysis of over one hundred World Series games. These values then had significance related to individual accomplishments. Additionally, his simulation could then compare an individual player’s performance to an average player’s performance for a given season. Palmer then went one step further and compared his run values of the different offensive events by twenty-year eras. Expressing his run values in “beyond-average runs,” which means how well did a player produce a run above the league average, he found that the values were remarkably similar from one era to the next. Listed in Table 6.1 is his chart of how various events produced run values.
Other books
The Third Sin by Elsa Klensch
Riding the Rap by Elmore Leonard
The Year of the French by Thomas Flanagan
Informed Consent by Saorise Roghan
Game Of Risk (Risqué #3) by Scarlett Finn
Brooklyn by Colm Tóibín
Kent Conwell - Tony Boudreaux 14 - Murder in a Casbah of Cats by Kent Conwell
Desde Rusia con amor by Ian Fleming
The Good Sister by Wendy Corsi Staub
Atherton #3: The Dark Planet (No. 3) by Patrick Carman