Understanding Sabermetrics (12 page)
Read Understanding Sabermetrics Online
Authors: Gabriel B. Costa,Michael R. Huber,John T. Saccoma

The Thorn and Palmer linear-weights model has been revised a few times since it was first published in the eighties, taking into account changes in the situational values. The coefficients for the values of the various hits (single, doubles, etc.) have been modified to account for actual changes in run production. In the 2006 edition of
Baseball Encyclopedia
, the formula is listed as:
Baseball Encyclopedia
, the formula is listed as:
Batting Runs = (0.47 × H) + (0.38 × 2B) + (0.55 × 3B) + (0.93 × HR) + [0.33 × (BB + HBP)] - [ABF × (AB - H)]
The “ABF” term is a league batting factor term, which scales the value of the average batter to 0. ABF is computed according to the following calculation:

All of the statistics in the ABF equation are league statistics. In addition, the “LGF” term is known as the league factor, and it adjusts for the quality of league play. It is scaled to 1 for American League and National League play, and it equals 0.8 for Union Association play (1884) and 0.9 for Federal League play (1914-1915).
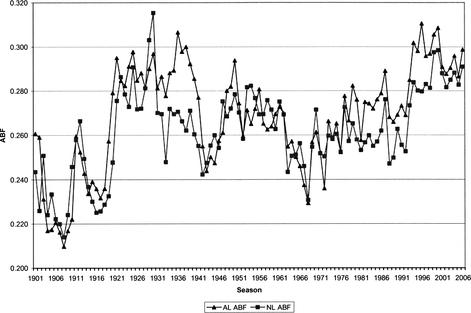
Figure 6.1 ABF for American and National Leagues, 1901 to 2006
This new batting runs formula thus becomes very involved. Why? Because the league batting-term factor, ABF, will vary from season to season and from American League to National League. For example, in 1966, the American League batting-term factor was 0.246, whereas forty years later in 2006 it was 0.299. Figure 6.1 shows how the ABF has changed since 1901. In addition, the new formula accounts only for batting runs and not for any runs produced by stealing bases. The coefficients for hits have changed from the 1984 formula.
From Figure 6.1, notice the relatively low ABF values during the Deadball Era and then the significant spike in values at the beginning of the 1920s. Interestingly, since the beginning of the designated hitter (1975), the ABF for the American League has been consistently higher than that of the National League. This should be expected, as the pitchers’ lower batting statistics are included in the NL ABF. Further, the steady increase in the annual value of the ABF correlates to a lower overall run production for hitters (a higher coefficient multiplies the at-bat minus hits total, thereby lowering the Linear Weights batting-runs value). The more recent years’ ABF for both American and National Leagues are listed in Figure 6.2.
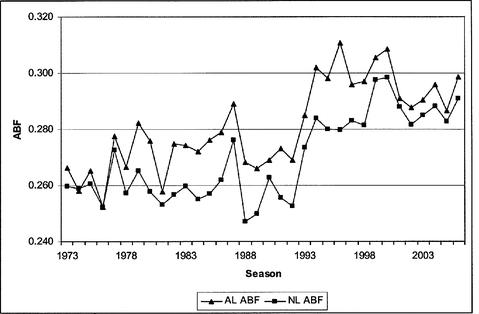
Figure 6.2 ABF for American and National Leagues, 1973 to 2006
Who is the best player of all time according to linear weights? In
The Hidden Game of Baseball
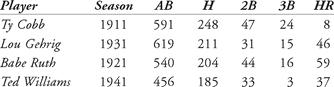
, Babe Ruth, not surprisingly, was listed as the hands-down leader in both career and single-season batting runs (Thorn and Palmer calculated their lists through the 1983 seasons). How have batters fared recently, during the so-called Longball Era? Using the 2006 Linear Weights formula with the ABF, let’s compare some of the great hitters using some of their premier seasons: Ty Cobb in 1911, Babe Ruth in 1921, Rogers Hornsby in 1925, Lou Gehrig in 1927, Ted Williams in 1941, Stan Musial in 1948, Mickey Mantle in 1957, Frank Robinson in 1966, Rod Carew in 1977, George Brett in 1980, Barry Bonds in 2001, Ichiro Suzuki in 2004, and Albert Pujols in 2005. Their statistics are listed in Table 6.3.
The Hidden Game of Baseball
, Babe Ruth, not surprisingly, was listed as the hands-down leader in both career and single-season batting runs (Thorn and Palmer calculated their lists through the 1983 seasons). How have batters fared recently, during the so-called Longball Era? Using the 2006 Linear Weights formula with the ABF, let’s compare some of the great hitters using some of their premier seasons: Ty Cobb in 1911, Babe Ruth in 1921, Rogers Hornsby in 1925, Lou Gehrig in 1927, Ted Williams in 1941, Stan Musial in 1948, Mickey Mantle in 1957, Frank Robinson in 1966, Rod Carew in 1977, George Brett in 1980, Barry Bonds in 2001, Ichiro Suzuki in 2004, and Albert Pujols in 2005. Their statistics are listed in Table 6.3.

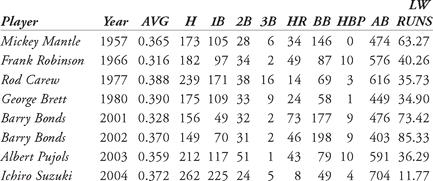
Table 6.3 Linear weights batting runs for selected hitters
From this exercise, we see that Barry Bonds’ 2002 season leads the way as the best season, even better than his record home run year of 2001. Although Ichiro Suzuki established the new record for hits in 2004, his run production was low, due to his lack of extra base hits and walks (he was penalized for his large number of at-bats and the corresponding 442 outs). The best season listed in Thorn and Palmer’s book was Ruth’s 1921 season. With the new formula, Ruth falls below Ted Williams, as well as below Bonds. Is the formula missing something? A degree of relativity is being introduced. Higher OPS and much larger batting averages lead to more runs per game.
When the linear-weights concept was first introduced, it was a refreshing yet powerful tool which could be used to compare a player’s performance with other players. The shadow statistic, on-base plus slugging (OPS), which was mentioned earlier, has been a benchmark in recent years. Most studies begin with an analysis of a player’s OPS and go from there. We have seen that the correlation between OPS and linear weights is 99.7 percent over an average team’s regular season.
How does OPS correlate with the accolades that are handed out to star players at the end of the season? Many player’s contracts now include incentive clauses to financially reward them if they are elected to the All-Star Game, or if they win a batting title, or for a host of other awards. (As an aside, in Japan, there is a daily incentive, which is separate from a player’s salary, and it is known as
kantoku shou
, which, translated literally, means manager prize. The Japanese manager gives money to a player who plays particularly well in a game — instant cash.) The Most Valuable Player Award is bestowed by the Baseball Writers Association of America (BBWAA) on the player who is deemed the best player in his league for the entire season. Since 1944, the MVP Award has been called the Kenesaw Mountain Landis Award in honor of the game’s first commissioner; the annual winners receive a trophy, and their names are engraved on a plaque in the National Baseball Library at the National Baseball Hall of Fame and Museum in Cooperstown, New York. Since 1938, votes have been cast using the
ranked choice
method. In this system, each voting member of the BBWAA votes for up to ten players, ranking each player from 1 to 10. The player ranked first on a ballot is then assigned 14 points, the player ranked second is assigned 9 points, on down to the player ranked who is ranked 10th, who receives one point.
It is interesting to examine the statistics of the winner of the Kenesaw Mountain Landis Award. How often does the league’s Most Valuable Player lead the American or National League in OPS or linear-weights runs? In Table 6.4, we present the statistics for the top three Kenesaw Mountain Landis Award vote-getters in both the American and National Leagues, for the years 2002 through 2006 (listed in order of votes received). What conclusions can we draw from this table?
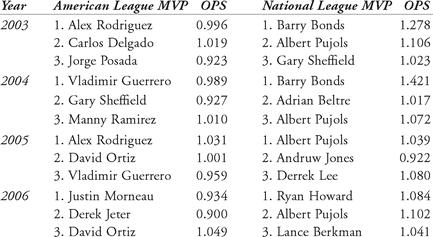
Table 6.4 Comparing league MVP ranking with OPS
Here are some more details: in 2006, Travis Hafner led the American League vote-getters in OPS (with 1.098), yet he finished 8th in the end-of-season MVP voting. In 2004, Manny Ramirez was the only American League MVP vote-getter whose OPS was greater than 1.000, yet he finished third when the votes were tallied. In 2003, Manny Ramirez again had an OPS above 1.000 (1.014), and his batting average was 27 points higher than Alex Rodriguez’s, but Ramirez finished 6th in the voting. In the National League in 2003, Albert Pujols had a batting average of .359 (compared to Barry Bonds’ .341), 212 hits (to Bonds’ 133), in over 200 more at-bats than Bonds. Yet Bonds won the award overwhelmingly. So what? This comparison shows that while statistics often support an argument for end-of-season tributes, non-sabermetrical arguments also play a part. Did Bonds win the 2003 award because he had already won the previous two years and five overall (the 2004 award gave him a record seven)?
Easy Tosses1. Using George Lindsey’s ratios of hit values, calculate the slugging percentage of the following players in the specific season:
Other books
Olivia Flies High by Lyn Gardner
The Girls by Amy Goldman Koss
Hand of God by Philip Kerr
First SEALs by Patrick K. O'Donnell
Wildfire Kiss by Claudy Conn
Bound by Blood (The Garner Witch Series) by Lupton, P.A.
My Super Sweet Sixteenth Century by Harris, Rachel
The Celebrity Doctor's Proposal by Sarah Morgan
Burying the Honeysuckle Girls by Emily Carpenter
A Darker Place by Jack Higgins