Understanding Sabermetrics (13 page)
Read Understanding Sabermetrics Online
Authors: Gabriel B. Costa,Michael R. Huber,John T. Saccoma

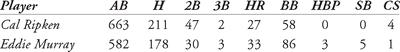
2. In 1983, Baltimore Orioles shortstop Cal Ripken won the American League Most Valuable Player Award over his teammate, first baseman Eddie Murray, in a close contest. Based on the original linear weights batting run production, who should have won the award? Here is the data:
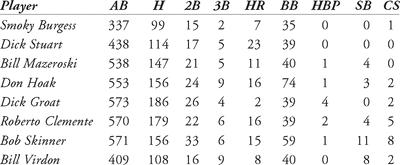
3. Using the original linear-weights model, calculate the batting runs for the starting line-up of the 1960 Pittsburgh Pirates: C Smoky Burgess, 1B Dick Stuart, 2B Bill Mazeroski, SS Dick Groat, 3B Don Hoak, and Outfielders Roberto Clemente, Bob Skinner, and Bill Virdon. Here is the data:
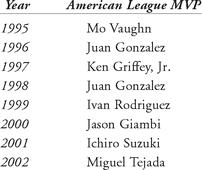
4. Listed below are the Kenesaw Mountain Landis Award winners for the American League Most Valuable Player for the years 1995 through 2002. Surprisingly, none of the league MVPs were on the World Champion team the year they won. Using a reference (i.e., statistics on the Internet), determine each player’s OPS. Who led the league in OPS each year and who on the World Series champion team had the highest OPS?
1. Calculate the batting runs for the top five home run hitters of all time, for the season in which each won his first Most Valuable Player Award: Hank Aaron in 1957, Barry Bonds in 1991, Babe Ruth in 1923, Willie Mays in 1954, and Sammy Sosa in 1998. Who contributed the most wins to his own team? Here is the data:

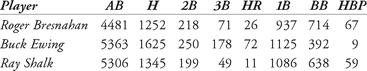
2. Consider the following Hall of Fame catchers, all of whom played before 1930: Roger Bresnahan, Buck Ewing, and Ray Schalk. Who contributed the most runs to his own team (use the condensed form for Linear Weights Batting Runs)? Here is the data:
3. Only six players have hit 60 or more doubles in a season (notice in which era they all occurred). They are:

Which of these hitters contributed the most linear-weights runs (condensed form) to his team during the indicated season?
Inning 5: The Linear Weights School — Pitching and Defense
Hall of Fame manager Earl Weaver said that the key to winning baseball games is pitching, fundamentals, and three-run homers. In chapter 4 we discussed the Linear Weights formula for batting runs which predicts the number of runs produced by an average baseball team based on all of the offensive events recorded during the game. It is used to evaluate a batter’s performance. Given that Thorn and Palmer viewed a home run as being worth three times as much as a single, Weaver’s three-run homer would indeed be effective. What about defense and pitching? In this chapter we summarize the linear-weights models for fielding and pitching, beginning with the latter.
Pitching RunsIn
Total Baseball
, Thorn and Palmer wrote that “determining the run contributions of pitchers is much easier than determining those of fielders or batters, though not quite so simple as that of base stealers. Actual runs allowed are known, as are innings pitched.” Roger Clemens has had a Hall of Fame career. At the close of the 2007 season, the Rocket had won 354 games, for a winning percentage of .658. His seven Cy Young Awards as his league’s top pitcher are a record. He has struck out 4672 opposing batters, which is second all-time, and his 24-year career earned run average (3.12) is almost one and a half runs below the league average over that same stretch. Seven times he led his league in earned run average. Both fans and opposing batters viewed the eleven-time All-Star Clemens as a dominant force every time he took the mound. Our questions is: how much did his performance contribute to his teams’ successes? Can we determine the run contributions of his starts? Should he have won seven Cy Young Awards?
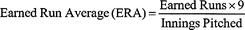
The linear-weights pitching-runs model assumes that pitchers are responsible only for earned runs. Thorn and Palmer argue that the earned run average statistic is an indication of a pitcher’s rate of efficiency, not an indication of his actual benefit to a team’s overall performance. As an example, if a team has two pitchers with identical ERAs who are compared against a higher league ERA, and pitcher A pitched in twice as many innings as pitcher B, then pitcher A must be worth twice as much as pitcher B to his team. The linear-weights pitching-runs statistic seeks to measure the number of runs, beyond the average, that a pitcher has prevented from scoring. The formula for earned run average is:
What about the average number of runs for a pitcher? This will equate to a pitching runs number of zero. The average number of runs is:

For example, in 2002, Roger Clemens had an ERA of 4.35 in 180 innings pitched for the New York Yankees. The American League average ERA was 4.38 runs (almost identical). Had Clemens’ ERA also been 4.38, he would have held opposing batters in check at the league average, regardless of the number of innings he pitched. In 2005, by contrast, Clemens, then with the Houston Astros, authored an amazing ERA of 1.87 in over 211 innings pitched. This was the lowest ERA for a season in Clemens’ 23-year career. The National League average was 4.14 runs. Surely, Clemens saved a significant number of runs that an average pitcher, pitching in his place, might have allowed. How to find that number? Thorn and Palmer’s linear-weights pitching-runs formula is straightforward and simple:

Other books
X20 by Richard Beard
Business and Pleasure by Jinni James
The Leopard's Prey by Suzanne Arruda
Grab (Letty Dobesh #3) by Crouch, Blake
Betting on Grace by Nicole Edwards
Dancing on Her Grave by Diana Montane
Second Chance by Angela Verdenius
The Subterranean Railway by Christian Wolmar
El desierto de hielo by Maite Carranza
Didn't My Skin Used to Fit? by Martha Bolton