Windows Server 2008 R2 Unleashed (133 page)
Read Windows Server 2008 R2 Unleashed Online
Authors: Noel Morimoto

6. Right-click on the NT Kernel trace object and select Properties. Note the events that
will be collected. Click Cancel to exit without saving.
7. Right-click on the Performance Counter object and select Properties. Note the perfor-
mance counters that will be collected. Click Cancel to exit without saving.
8. Right-click on the System Performance Data Collector Set and select Start. The Data
Collector Set will start collecting data.
9. Right-click on the System Performance Data Collector Set and select Latest Report.
The report will show a detailed analysis of the system performance. The Summary and the
Diagnostic Results are shown in Figure 20.7. The Diagnostic Results indicate that memory
is the busy component on the DC1 server. The report contains a wealth of details on the
CPU, Network, Disk, Memory, and overall report statistics.
ptg
20
FIGURE 20.7
System Performance Report in Performance Monitor Data Collector Sets.
You can also view the performance data that the report is based on directly. This can be
done by right-clicking the specific report and selecting View, Performance Monitor. This
shows the graph of all the counters selected during the data collection. You can select
which counters to show in the graph.
656
CHAPTER 20
Windows Server 2008 R2 Management and Maintenance Practices
The System Performance Data Collector Set only collects for 1 minute, which is not long
enough for detailed trend analysis. New Data Collector Sets can be defined in the User
Defined folder. For example, to create a duplicate of the System Performance Data
Collector Set that will run for an hour instead of a minute, do the following:
1. Launch Server Manager.
2. Expand the Diagnostics node.
3. Expand the Performance node.
4. Expand the Data Collector Sets node.
5. Select the User Defined node.
6. Right-click on the User Defined node and select New, Data Collector Set.
7. Enter System Performance 1 Hour for the name and make sure that the Create from
a Template is selected. Click Next.
8. Select System Performance and Click Next.
9. Click Next to keep the default root directory.
10. Select the Open properties for this Data Collector Set and click Finish.
11. Click on the Stop Condition tab.
12. Change the Overall Duration setting to 1 hour.
ptg
13. Click OK to save.
This Data Collector Set can now be run and will collect the same data as the default
System Performance, but for 1 hour instead of just 1 minute.
Device Manager
The Device Manager node shows the hardware that is installed on the server. It shows the
hardware grouped by type of device, such as Disk Drives, Display Adapters, and Network
Adapters. Each instance of the device type is listed in a node underneath the device type.
The Device Manager can be used to update the device drivers of the hardware, to change
settings, and to troubleshoot issues with the hardware. Specifically, you can perform the
following tasks:
. Scan for new hardware
. Identify hardware problems
. Adjust configurations
. View device driver versions
. Update the device drivers
. Roll back device driver upgrades
. Enable or disable hardware
For example, sometimes older video drivers or network card drivers will cause problems
with the system. It is easy to check the Microsoft online driver repository using Device
Server Manager Configuration Page
657
Manager. To check for an update to the device driver for the network adapter, follow
these steps:
1. Expand the Network Adapters node in Device Manager.
2. Select the network adapter to check.
3. Select Action, Update Driver Software from the menu.
4. Click on Search Automatically for Updated Driver Software.
5. Click on Yes, Always Search Online (Recommended).
6. Install the update if found.
7. Click Close to exit the wizard.
NOTE
Many times, the latest version of the driver will already be installed. In these cases,
the message “The best driver for your device is already installed” will be shown.
Server Manager Configuration Page
ptg
The Configuration page in Server Manager is somewhat misleading. This is not the page
from which you would configure the server. The Configuration node in Server Manager is
simply a container for the following four snap-ins:
. Task Scheduler
. Windows Firewall with Advanced Security
. Services
. WMI Control
These snap-ins enable the administrator to control some elements of the server configura-
tion and are covered in the next four sections.
Task Scheduler
One of the greatly expanded features of Windows Server 2008 R2 is the Task Scheduler.
In previous versions of Windows, this was an anemic service with limited options and
auditing features. The Task Scheduler features in Windows Server 2008 R2 have been
expanded into a more sophisticated tool. The scheduler can start based on a variety of
20
triggers, can take a number of predefined actions, and can even be mitigated by condi-
tions and the settings.
Appropriately, there are expanded elements to the Task Scheduler, as follows:
.
Triggers—
Tasks run when the trigger criteria are met. This could be a scheduled
time, logon, startup, idle, log event, user session connect or disconnect, or worksta-
tion lock or unlock. These various triggers give the administrator a wide range of
options on when to start a task.
658
CHAPTER 20
Windows Server 2008 R2 Management and Maintenance Practices
.
Actions—
The actions are the work that the task will perform. This can be executing
a program, sending an email via SMTP, or displaying a message on the desktop.
.
Conditions—
Conditions allow the task trigger criteria to be filtered. Conditions
include if the computer is idle, on battery power, or connected to a network. This
allows administrators to prevent tasks from running if the computer is busy, on
battery, or disconnected from the network.
.
Settings—
The settings control how a task can be executed, stopped, or deleted. In
the settings of a task, the administrator can control if the task can be launched man-
ually, if it runs after a missed schedule start, if it needs to restart after a failure, if it
needs to run multiple tasks in parallel, or to delete it if it is not set to run in the
future.
Another big improvement is the Task Scheduler Library, which includes approximately 40
different predefined tasks. These tasks include the following:
.
ScheduledDefrag—
This task runs every week and uses the command defrag.exe
–c to defragment all the volumes on the server. This is a major improvement of
previous versions of Windows, which required this command to be run manually.
The task runs at 1:00 a.m. every Wednesday of every week by default.
.
ServerManager—
This task runs at user logon and runs the ServerManagerLauncher
ptg
to launch the Server Manager console whenever a user logs on.
Both these tasks demonstrate the capabilities of the Task Scheduler to automate routine
tasks or to ensure that certain tasks run at logon.
The Task Scheduler has a new feature that goes hand in hand with the library, namely the
ability to create folders to store the tasks. This helps organize the tasks that are created.
The scheduler includes a Microsoft folder for the tasks that ship with the operating
system. Administrators can create other folders to organize and store their tasks.
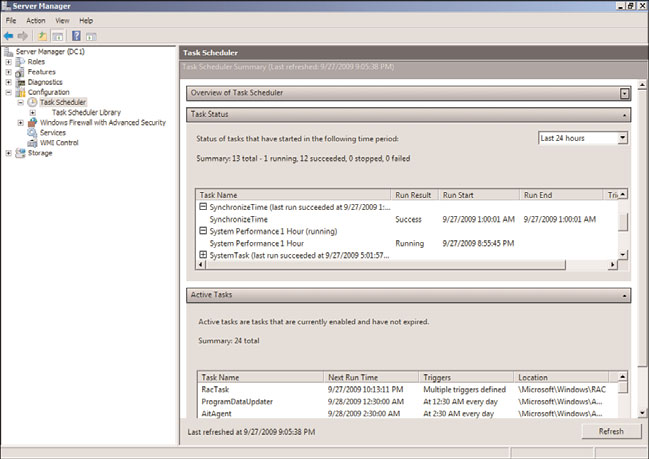
Selecting the Task Scheduler folder in the Server Manager configuration shows the Task
Scheduler Summary (shown in Figure 20.8). This window has two sections: Task Status and
Active Tasks. The Task Status section shows the status of tasks within a time frame (by
default, the last 24 hours). The time frame can be set to the last hour, last 24 hours, last 7
days, or last 30 days. For each task that has run within the time frame, it shows the Task
Name, Run Result, Run Start, and Run End. The section also summarizes the task status;
Figure 20.8 shows that 13 total tasks have run with 1 running and 12 succeeded. The
figure also shows that it is the System Performance 1 Hour data collector task that was
created earlier that is running.
The Active Tasks name is somewhat misleading because it shows tasks that are enabled
and their triggers. It does not show tasks that are running. For the scheduled tasks, it
shows the Next Run Time. This section is very useful for seeing which tasks will run on a
given server in response to a trigger, either a schedule or an event. If the task does not
appear in this section, it will only be run if executed manually.
Server Manager Configuration Page
659
FIGURE 20.8
Task Scheduler Summary window.
ptg
Windows Firewall with Advanced Security
The Windows Firewall with Advanced Security feature provides access to the combined
Windows Firewall and Connection Security features of Windows Server 2008 R2. These
technologies work in tandem to provide protection from network-based attacks to the
server. The firewall rules determine what network traffic is allowed or blocked to the
server. The connection security rules determine how the allowed traffic is secured.
The Windows Firewall and the Connection Security features are covered in detail in
Chapter 13, “Server-Level Security,” and Chapter 14, “Transport-Level Security.”
The Windows Firewall with Advanced Security folder shows a summary of which profile is
active (Domain, Private, or Public), the profile’s high-level configuration, and links to the
other components of the snap-in.
The other components of the Windows Firewall with Advanced Security snap-in are for
configuration and monitoring the features. These components are as follows:
20
. Inbound rules
. Outbound rules
. Connection Security rules
. Monitoring
660
CHAPTER 20
Windows Server 2008 R2 Management and Maintenance Practices
The inbound and outbound rules control what traffic is allowed in to and out of the
server. There are several hundred rules governing what traffic is allowed. These are orga-
nized into profiles for ease of application. Table 20.2 shows these profiles.
TABLE 20.2
Firewall Profiles
Profile
Description
Domain
Applied when the server is connected to its Active Directory domain.
Profile
Private Profile
Applied when the server is connected to a private network but not to the Active
Directory domain.
Public Profile
Applied when the server is connected to a public network.
Clearly, the vast majority of services will have the Domain Profile active, as they will likely
be on a network with Active Directory. Each of the profiles has a set of rules associated
with it. In addition, a number of rules apply to all profiles, which are designated as “Any.”
Some of the rules are disabled by default.
Connection Security rules are stored in the likewise named folder. The rules specify how
ptg
the computers on either side of a permitted connection authenticate and secure the
network traffic. This is essentially the IPSec policy from previous versions of Windows,
albeit with a much improved interface. By default, there are no Connection Security rules
created in Windows Server 2008 R2. Rules can be created and reviewed in this portion of
the snap-in.
The Monitoring folder is somewhat limited in scope. It has a Firewall folder and a
Connection Security Rules folder. These two folders simply show what rules are active, but
show no traffic details or if the rules have blocked or allowed anything. In effect, they
show the net result of the profile that is active.
Services
The Services snap-in in the Configuration container in Server Manager is essentially
unchanged from the previous version of Windows. All the services are listed, along with
their status, startup type, and logon credentials.
From the Services snap-in, administrators can control services on the server, including
the following: