Windows Server 2008 R2 Unleashed (165 page)
Read Windows Server 2008 R2 Unleashed Online
Authors: Noel Morimoto

C. Change Priority?
If yes, create an override to change the alert priority to low. This
keeps the alert as a critical alert, but prevents an email from being generated. This
would be done if the alert is real, but is not resolvable in the immediate future.
D. Change Threshold?
For performance-based alerts, there is the option to change
the trigger threshold to a different value. This would be done if the problem is real
and actionable, but the alert is firing too soon.
These options can be taken for all objects of the target class, for just the specific instance
that generated the alert, or for a group. The group would have to be created in advance
and would have to contain objects of the type targeted by the monitor or rule generat-
ing the alert.
For example, let’s say there is an Application of Group Policy critical alert that is occurring
frequently in the environment. It is occurring on a number of Windows Server 2008 R2
servers and is generating a lot of email notifications. This alert is valid, but does not
require immediate action. The alert needs to be tuned to change the severity from critical
to warning. The steps to tune the alert are as follows:
1. Open the Operations Manager 2007 R2 console.
2. Select the Monitoring space.
3. Select the Active Alerts view.
4. Locate and select the Application of Group Policy alert that is to be tuned.
Using Operations Manager 2007 R2
839
5. Right-click the alert and select Overrides, Override the Monitor, and For All Objects of
Class: Group Policy 2008 Runtime. This overrides the alert for all objects of that class.
NOTE
The alert is to be tuned for all objects, rather than any specific instances. If the alert is
to be tuned for the specific instance that raised the alert, the For the Object option
should be chosen. If it is a group of the objects, the For a Group option should be cho-
sen. The group would have to be precreated and be a group of the target objects.
23
6. Check the Override box next to Alert Severity and set the value to Warning.
7. In the Select Destination Management Pack pull-down menu, select the appropriate
override management pack. If none exists, create a new override management pack
named “Group Policy MP Overrides” by clicking New.
NOTE
Never use the Default Management Pack for overrides. Always create an override man-
agement pack that corresponds to each imported management pack.
ptg
8. Click OK to save the override.
Now the next time the monitor triggers an alert, it will be of warning severity and will not
generate a notification email. However, the alert can still be reviewed in the console.
This approach to tuning will address 90% of the noisy alerts that you get. To target the
noisiest alerts, see the report Most Common Alerts in the next section. This helps identify
the alerts that are responsible for the most noise. You’ll frequently find that 50% of your
alerts are coming from less than five rules or monitors. Tuning those will give you the
most bang for your buck.
Scheduling Reports
The Operations Manager 2007 R2 infrastructure collects many Windows Server 2008 R2
data points. This information can be presented in reports, which can be generated ad hoc
or scheduled. The scheduling option is very useful, as it reduces the need to actively open
the console and instead the reports are delivered via email.
Performance Reports
When managing a number of agents, it can be difficult to pinpoint the problem systems.
For example, which systems are the most heavily utilized? A report showing a graph of all
the resources would be very messy and difficult to read even in a medium-sized organiza-
tion with a number of servers. Operations Manager 2007 R2 has a set of reports that
address this specific concern, the Performance Top Objects and Performance Top
840
CHAPTER 23
Integrating System Center Operations Manager 2007 R2 with
Windows Server 2008 R2
Instances. These reports take data from performance collection rules, perform some statis-
tical analysis, and list the top systems.
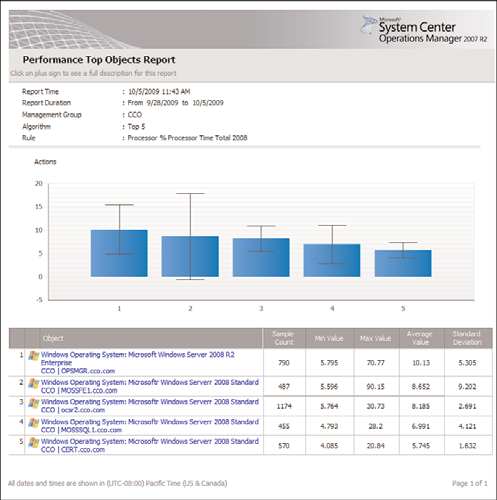
For example, Figure 23.12 shows the top five systems with the most processor utilization.
It is based on the “Processor % Processor Time Total 2008” rule. It shows the top five
heaviest processor utilization systems for the previous week.
ptg
FIGURE 23.12
Top five processor utilization report.
This report is one of the reports in the Microsoft Generic Report Library and can be used
against any performance counter. The report can pick the top (the default) or bottom
objects, as well as vary the number of objects to return (the default is five).
The best-practice recommendation is to generate daily reports spanning the previous week
for the following rules:
. Processor % Processor Time Total 2008
. Page File Percentage Use 2008
. Memory % Committed Bytes in Use 2008
. Network Adapter Bytes Total per Second 2008
. % Logical Disk Free Space 2008
Using Operations Manager 2007 R2
841
The Performance Top Objects report for each of these rules gives a good overview of the
performance issues (or lack thereof) over the collection of all the monitored systems.
These should be delivered on a daily basis in an email or to a share.
To schedule a report for email delivery, use the following steps:
1. Launch the Operations Manager 2007 R2 console.
2. Select the Reporting space.
3. Select the Microsoft Generic Report Library node.
4. Right-click the Performance Top Objects report and select Open.
23
5. In the From field, select Advanced.
6. Change the Offset to minus and the number of days to 7. Click the green check
mark (OK) to save the selections. The From field will show “Today -7 day(s)”.
7. Change both the From and the To times to 12:00 AM.
8. In the Rule field, click the Browse button.
9. In the Rule Name field, enter Processor % Processor Time Total 2008 and click
the Search button.
10. In the Available Items pane, select the rule and click OK.
ptg
11. Click Run and confirm that the report looks good.
12. Select File, Schedule.
13. In the Description, enter Processor % Processor Time Total 2008 Report.
14. In the Delivery Method field, select Email.
15. In the To field, enter the SMTP address of the recipient.
16. In the Subject field, replace @ReportName with Processor % Processor Time Total
2008 Report. The variable name is unfortunately very long and ugly, so it’s best to
replace it.
17. Click Next.
18. Change the schedule to Daily.
19. Change the time to be the time that the report should be generated on a daily basis,
for example 6:00 a.m. Click Next.
20. Because the report was generated and all the parameters were selected initially, no
parameters need to be changed. This method ensures that the email report will
match expectations.
21. Click Finish to save the scheduled report.
The report will now be automatically generated every morning at 6:00 a.m. and delivered
via email to the recipients. Additional reports can be created in exactly the same way for
the recommended rules and any others that are needed. To review the schedules, go to the
Scheduled Reports node in the Reporting space. The schedules can be adjusted as well.
842
CHAPTER 23
Integrating System Center Operations Manager 2007 R2 with
Windows Server 2008 R2
NOTE
The performance rules are generally specific to each operating system. Thus, the
reports are specific to each operating system. The rules in this section reflect Windows
Server 2008 and Windows Server 2008 R2 performance data. If there are other oper-
ating systems such as Windows Server 2003, additional reports using those rules
would need to be created.
OpsMgr 2007 R2 Maintenance Reports
There are also reports on Operations Manager 2007 R2 that should be generated to ensure
that the health and performance of the infrastructure is good. The reports to generate are
as follows:
.
Most Common Alerts—
This report is useful for determining what alerts are the
noisiest and might be spamming the Inboxes of notification subscribers. The report
shows which alerts are most common and gives additional statistical analysis.
.
Alert Logging Latency—
This report is useful for determining the health of the
OpsMgr infrastructure, as measured by the time an event occurs on a managed
computer to the time an alert is raised. If this is too long (that is, greater than 30
seconds), it indicates that there is a problem.
ptg
.
SQL Database Space report—
This report shows the database space and growth of
SQL databases. This is generated against the OpsMgr databases to monitor the
growth.
These reports should be generated on a weekly basis (for example, Monday at 6:00 a.m.)
spanning the previous week and be sent to the Operations Manager administrators.
The Most Common Alerts report is based on the management packs that are installed. By
default, the report selects all the installed management packs and shows the top five most
common alerts. To schedule the Most Common Alerts report, execute the following steps:
1. Launch the Operations Manager 2007 R2 console.
2. Select the Reporting space.
3. Select the Microsoft Generic Report Library node.
4. Right-click the Most Common Alerts report and select Open.
5. In the From field, select Advanced.
6. Change the Offset to minus and the number of days to 7. Click the green check
mark (OK) to save the selections. The From field will show “Today -7 day(s)”.
7. Change both the From and the To times to 12:00 AM.
8. Click Run and confirm that the report looks good.
9. Select File, Schedule.
10. In the Description, enter Most Common Alerts Report.
11. In the Delivery Method field, select Email.
12. In the To field, enter the SMTP address of the recipient.
Using Operations Manager 2007 R2
843
13. In the Subject field, replace @ReportName with Most Common Alerts Report.
14. Click Next.
15. Change the schedule to Weekly and ensure that only Mon is checked.
16. Change the time to be the time that the report should be generated on a daily basis,
for example 6:00 a.m. Click Next.
17. Because the report was generated and all the parameters were selected initially, no
parameters need to be changed. This method ensures that the email report will
match expectations.
18. Click Finish to save the scheduled report.
23
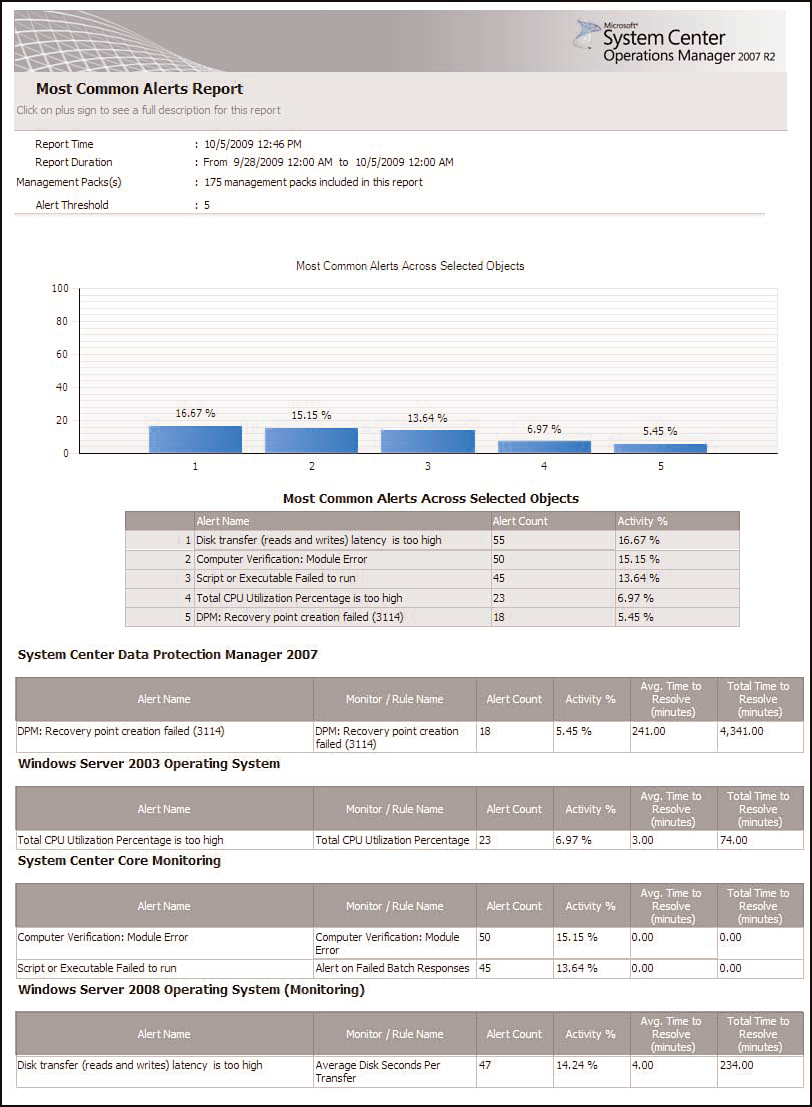
Figure 23.13 shows an example of the Most Common Alerts report. The most common
alert for the previous week was the Disk Transfer Latency Is Too High, with 16.67% of
alerts. This alert could be tuned to reduce the volume of alerts or the problem resolved.
ptg
FIGURE 23.13
Most Common Alerts report.
The Alert Logging Latency report is based on the objects selected. The report does not
include any objects by default, so the objects must be selected. It is a best practice to select
the groups of agents, agentless, and agent watchers objects. To schedule the Alert Logging
Latency report, execute the following steps:
844
CHAPTER 23