X and the City: Modeling Aspects of Urban Life (52 page)
Read X and the City: Modeling Aspects of Urban Life Online
Authors: John A. Adam

In their book
Fractal Cities
[
1
], Michael Batty and Paul Longley tabulate the estimated fractal dimension
D
for 28 cities.
Table 18.1
contains some of these estimates (to three significant figures). There is also some evidence to suggest that fractal dimension has a tendency to increase as a city grows; Batty and Longley note that from 1820 to 1939 the estimates of
D
increase from 1.32 to 1.79, though it did drop slightly to 1.77 in 1962 and farther still to 1.72 in 1981.
It will be interesting to see how this relatively new subject of fractal cities itself “evolves” over time. Some indications are already at hand, as discussed in the section below.
=
N
(
t
): LARGER CITIES ARE “FASTER”
In a fascinating paper published in 2007 [
32
], the first sentence reads “Humanity has just crossed a major landmark in its history with the majority of
people now living in cities.” The title of this paper, by Bettencourt et al., was “Growth, Innovation, Scaling, and the Pace of Life in Cities.” One major finding was that many diverse properties of city life, designated here by
y
(
t
), are simple power law functions of population size
N
(
t
), that is,

In other words, they “scale” as power laws. Examples of
y
(
t
) are total electrical consumption, gross domestic product, and number of gasoline stations. In one sense, this is hardly surprising; these and many other properties will in general increase with population size. Nevertheless, the remarkable fact appears to be that for quantities representing wealth creation and innovation, the power law exponent
β
≈ 1.2.
β
> 1 implies increasing returns;
β
< 1 implies economies of scale. This latter situation occurs for city infrastructure, where
β
≈ 0.8. Furthermore,
β
≈ 1 is associated with individual human needs (jobs, housing, water consumption), so that these quantities tend to be directly proportional to population size.
Understanding the implications of these power laws is crucial because, as the authors point out, “
a major challenge worldwide is to understand and predict how changes in social organization and dynamics resulting from urbanization will impact the interactions between nature and society.”
There is a balance between the innovative and destructive aspects of city living, however. In addition to providing large-scale social services, education, and health care, for example, cities are the main source of crime, pollution, and disease in society.
In some ways cities can be thought of as living organisms because they consume energy and produce artifacts and waste. It is therefore not surprising that there are biological metaphors associated with the “scaling” phenomenon illustrated above (as already noted in
Chapter 1
). For example, as indicated above, the surface area of an object is proportional to (i.e., scales as) the square of its size (linear dimension), and its volume scales as the cube of its size. More specifically, many if not most physiological properties of biological organisms scale with body mass
M
with an exponent
β
that is a multiple of ¼ (this is a generalization of Kleiber’s law, mentioned above). Thus the metabolic rate per unit mass
R
∝
M
−1/4
decreases with body size. This means that larger organisms consume less energy per unit time and per unit mass. Inversely, life spans and maturation times scale as
M
1/4
. Nevertheless, there are differences: larger organisms live by slower biological clocks, by virtue of
the inverse quarter power law referred to above, whereas the pace of city life
increases
with size, as we shall see below. As the authors of the article point out, scaling has proved to be a valuable tool for revealing underlying dynamics and structure for many problems encountered in science and technology. In what follows, we discuss some implications of the “urban growth equation” derived in that paper.
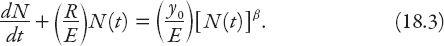
We are interested in deriving and subsequently solving an equation for the population growth rate,
dN
/
dt
, in terms of resources for maintenance and growth per unit time mentioned above (
y
) and two other parameters,
R
and
E
.
R
is defined as the amount of resource(s) per unit time required to maintain an individual;
E
is the amount required to add another individual to the population. Then for Δ
N
individuals added in time Δ
t
the resource allocation rate equation may be written, in the appropriate limit as

The left-hand side of this equation is a measure of the available resources, balanced on the right by consumption terms due to maintenance and population growth, respectively. Substituting for
y
from equation (18.1) and rearranging we find that
This is a
Bernoulli equation
; the substitution
v
=
N
1−
β
reduces this to a linear equation with integrating factor
The resulting solution of equation (18.3) for
β
≠ 1 is
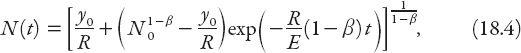
where
N
0
=
N
(0).
Exercise:
Derive equation (18.4).
There are three basic forms of solution depending on whether
β
> 1,
β
= 1 or
β
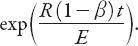
< 1. The simplest case,
β
= 1, has the solution (using equations 18.1 and 18.2)

This represents, of course, simple exponential growth or decay depending on the sign of the exponent. For
β
< 1 the growth curve is sigmoidal (sometimes called Gompertz-like); as can be seen from equation (18.4), there is a horizontal asymptote—the carrying capacity (see
Chapter 15
)—found by taking the limit as
t
→ ∞. Its value is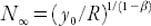 . This is quite a significant result, for it means that there is an upper limit to the size of the population: it will eventually stop growing (in practical terms, after a very long but finite time). As we saw in
Chapter 15
, this is very similar to biological systems in which the competition between finite resources and population growth eventually results in saturation of the population (even in the simplest models). The urban equivalent of “finite resources” in biology or ecology is referred to in the article as “economies of scale.” A typical graph of
N
(
t
) is shown in
Figure 18.1
for a simple choice of parameters in equation (18.4), expressing in units of, say, 100,000. The initial value
N
0
= 1, with
β
= 0.5, and the carrying capacity
N
∞
= 25 are chosen here for illustrative purposes.