Teaching the Common Core Math Standards With Hands-On Activities, Grades 3-5 (16 page)
Read Teaching the Common Core Math Standards With Hands-On Activities, Grades 3-5 Online
Authors: Judith A. Muschla,Gary Robert Muschla,Erin Muschla-Berry
Tags: #Education, #Teaching Methods & Materials, #Mathematics, #General

Closure
Ask your students how their estimates compared to the actual measurements. Who was closest? Ask for volunteers to share their problems with the class so that other students may solve the problems. Discuss the problems and their answers.
Names _____________________________________ Date
_____________
Recording the Metric Monster Mass
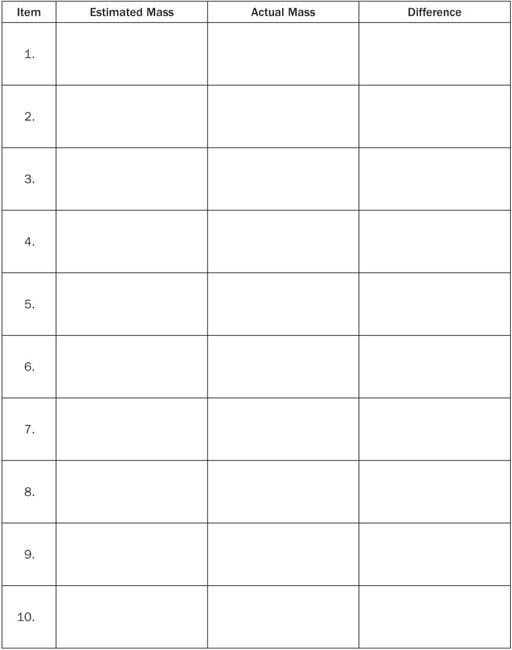
Total Mass ________________
Measurement and Data: 3.MD.3
“Represent and interpret data.”
3. “Draw a scaled picture graph and a scaled bar graph to represent a data set with several categories. Solve one- and two-step ‘how many more’ and ‘how many less’ problems using information presented in scaled bar graphs.”
Background
Picture graphs and bar graphs are two very common methods of displaying data. A picture graph is a graph that uses pictures or symbols to display data. A bar graph is a graph that uses horizontal or vertical bars to display data.
Activity: Picture Graphs and Bar Graphs
This activity begins with the teacher gathering data by conducting a poll of the class. Working in pairs or groups of three, students will create scaled picture graphs and bar graphs to represent the data. They will also solve problems based on the graphs.
Materials
Unlined white paper; rulers; markers; crayons; colored pencils for each pair or group of students.
Preparation
Conduct a poll of favorites of your students. You might ask students what their favorite flavor of ice cream is (for example, chocolate, vanilla, strawberry, cherry, other); their favorite sport (baseball, football, soccer, basketball, hockey, other); their favorite type of school lunch (pizza, hamburger, hot dog, taco, pasta, other). Of course, you may choose other topics, but whichever topic you choose, limit the possible choices to 5 or 6.
Procedure
1.
Conduct the poll and write the data on the board.
2.
Explain that picture graphs display data as pictures or symbols. Each picture or symbol represents a specific quantity, which is shown in a legend on the graph. Show your students examples of picture graphs in their math or other texts. You may also find many examples online by searching for “picture graphs.” Discuss the graphs and point out how they are constructed.
3.
Explain that a bar graph displays data using vertical or horizontal bars. The scale of a bar graph typically represents numerical data. Note that the data is labeled and the bars are separated by a space. Show your students examples of bar graphs in their math or other texts. You may also find many examples online by searching for “bar graphs.” Discuss the graphs and point out how they are constructed.
4.
Instruct your students to construct a picture graph and a bar graph, using the data obtained in the poll you conducted at the beginning of the activity. Suggest that they choose a simple picture to represent data for their picture graph and create a legend showing the value of each picture. For their bar graph they should create a scale to represent the data, and be sure to label each bar. They should construct their graphs neatly and accurately, and include a title for each graph.
5.
After students have constructed their graphs, ask them questions based on comparisons of the data, especially questions that focus on “how many more,” and “how much less.”
Closure
Ask your students to summarize the steps for constructing picture graphs and bar graphs:
- Obtain data.
- Determine a scale or legend, depending on the graph.
- Draw the graph.
- Show and label the data accurately.
- Include a scale or legend that shows the value of the data on the graph.
- Title the graph.
You may also want to display students' graphs.
Measurement and Data: 3.MD.4
“Represent and interpret data.”
4. “Generate measurement data by measuring lengths using rulers marked with halves and fourths of an inch. Show the data by making a line plot, where the horizontal scale is marked off in appropriate units—whole numbers, halves, or quarters.”
Background
A line plot, also known as a dot plot, displays data along a number line. Each value of the data is marked with a symbol noting the frequency.
For example, suppose that you wish to draw a line plot, showing the hand span of five students in inches: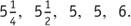 The line plot appears below.
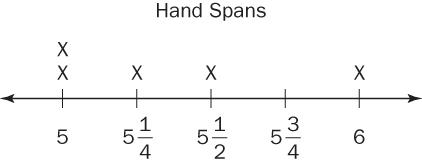
Note that an “X” is placed above the value each time the value appears.
Working in pairs or groups of three, students will measure their hand spans and draw a line plot that shows the hand spans of the students in class.
Materials
Rulers with a-inch scale; reproducible, “Hand Span Data Sheet,” for each pair or group of students.
Procedure
1.
Explain that students will measure their hand span—the distance between the tip of the pinkie finger and the tip of the thumb when the hand is open, palm down.
2.
Demonstrate a hand span by placing your hand palm down on the board, marking the tip of your pinkie and the tip of your thumb. Then measure the distance between these two points to the nearest quarter inch.
3.
Instruct your students to find their hand span and record its length to the nearest quarter inch. If necessary, the student's partner can help measure.
4.
Distribute copies of the reproducible. Note that it contains a table (broken into three parts) with rows numbered 1–30 and a horizontal line at the bottom that will serve as the line plot.
5.
Call the name of the first student in your grade book. Ask for his or her hand span. Students will record this distance in Row 1 on the reproducible. You may find it helpful to write the data on the board.
6.
Continue until all the names of your students have been called and everyone has announced his or her hand span. The number of completed rows in the table should be the same as the number of students in class.
7.
Explain how to construct the line plot.
- Find the smallest and largest hand spans.
- Place a small vertical line near the left arrow on the horizontal line at the bottom of the reproducible to represent the smallest hand span.
- Using a ruler and starting with the smallest value, mark the number line at
 -inch intervals, stopping at the number representing the largest hand span.
 - Place an X every time a value is given.