The Origins of the British: The New Prehistory of Britain (54 page)
Read The Origins of the British: The New Prehistory of Britain Online
Authors: Oppenheimer

It is very likely that north-west Europeans had mixed Ice Age origins, but it is more difficult to know exactly what mix there was at the beginning. However, if we use the analogy of the Y-chromosome evidence, with Ruisko originating from the Basque country and Rostov, Ian and Ingert from the Balkans rather later (see
Chapters 4
and
5
), we could estimate a mixture of around 60% of the O gene and 40% of the A gene in Frisia/Saxony during the Neolithic. Allowing for the presence of the group B gene (5–10%), this is not far off the actual rate. But then we would also expect to see nearly the same relative frequencies in England, on the basis that England had a rather similar parallel post-glacial recolonization history to Frisia. Group A genes in England would, however, be somewhat less frequent than in Frisia, say between 25% and 30%, but higher than Wales and Ireland, which would have only around 5–10%. Again, these
two regional relative frequencies would more or less fit the real blood group data, which are that blood group A gene rates are the same either side of the North Sea, at 25–30%. So on these figures, a common parallel ancient history of colonization either side of the North Sea could be a more likely reason for similarity than a recent ‘Germanic’ invasion and replacement.
But how could we tell from these predicted Neolithic figures what the true history of subsequent interchange was between Frisia and England, or between Germany and England, if the gene frequencies were already so similar on either side of the North Sea? Several scenarios could have produced the same outcome. First, following one of the main historical myths in this book, we could suggest a model of the holocaust/
Lebensraum
type, with 100% replacement by Anglo-Saxons (in this case Frisians and/or Germans) of ‘indigenous’ Britons. A second possibility is of recurrent invasions from Frisia/Germany to England over the whole post-glacial period, leading gradually to similar mixes. Third, there may have been parallel, long-term, independent colonization of England and Frisia/north-west Germany from the same two remote sources (the Balkans and the Basque Country); there need not necessarily have been any later local invasion either way across the North Sea. And there could, of course, have been some combination of the three.
The three models outlined above allow us to look at the current genetic literature on the Anglo-Saxon invasion in some perspective. As should be clear by now, the highest-definition genetic information available for the British Isles is from the Y chromosome. The relevant half-dozen investigations of the past
five years created the systematically sampled datasets that I have combined to make the composite Y dataset used for analysis throughout this book, but they each come to quite different conclusions. The common dataset thus helps make it possible to work out how they came to such different answers.
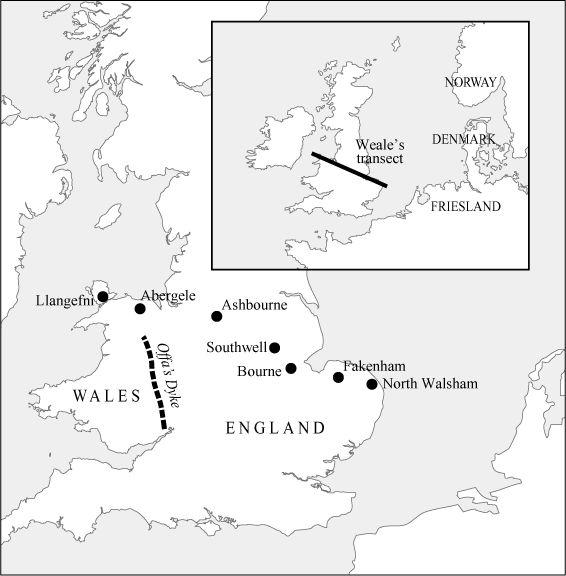
A key paper published in 2002 by Michael Weale of University College London and colleagues focused on the Anglo-Saxon question. To address the question of whether there is any difference between Wales and England, they used seven sample populations strung in an east–west ‘transect line’ from North Walsham in Norfolk west to Llangefni in Anglesey, north Wales (all shown in
Figure 11.2a
). For comparison, they also used samples from Friesland and Norway ‘to look for evidence of male immigration from the continent’.
20
Their British samples were carefully selected to represent stable populations from at least the time of the Domesday Book (1086).
21
In his analysis, Weale wanted to explore three different population processes: simple splitting with subsequent divergence, single mass migration (analogous to the first model described above) and continuous background migration (analogous, but not identical, to the third model, since no other previous sources of migration are considered). Since none of the available mathematical methods allowed these three processes to be examined simultaneously, in their own words they ‘developed an alternative inference method that allowed [them] to explore more flexible models under a range of historical scenarios involving both background [migration] and mass migration in the presence of population splitting and growth’.

Figure 11.2a
Weale’s British transect line and Continental ‘homelands’. The aims of Weale’s study were to genetically sample seven ancient market towns in a line from Norfolk to north Wales, and to determine whether the line of Offa’s Dyke formed a genetic boundary – and, if so, why.
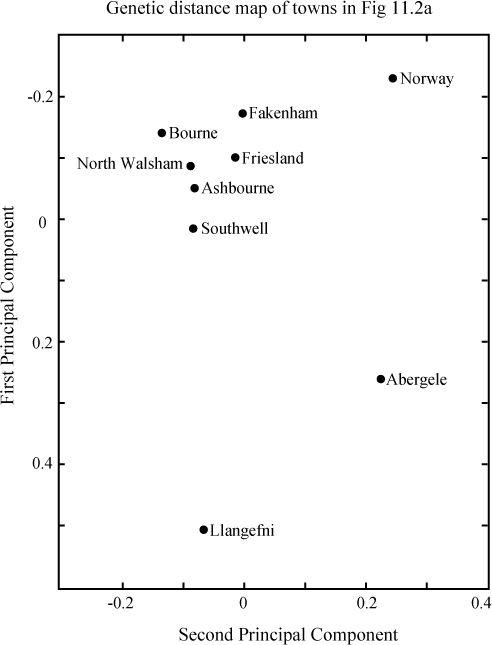
Their results were displayed as a virtual genetic distance map. This was constructed by doing the same Principal Components Analysis (PCA) on gene frequencies I described in
Chapter 6
, and then plotting the value of the First Principal Component against the Second Principal Component for each population sample (
Figure 11.2b
). This kind of two-dimensional plot is commonly used to simplify and display results for multiple gene types. Using two axes helps to spread out the dots more. It sounds arcane, but the results are clear on the map and can be summarized as follows.
22
The Central English towns were genetically as like Friesland as peas in a pod, and all very different from Wales, but less so from Norway. The main genetic
reasons
for the similarities between Central England and Friesland and their differences from Wales were, they argued, the similar relative frequencies of their two male groups (which are nearly coincident with Ruisko and Ivan in this book). Ruisko dominates Western Europe, but more particularly Wales and the Atlantic Fringe, like the blood group O gene, and Ivan appears, like the blood group A gene, as a minority intruder at rates of 25–30% in north-west Europe.

Figure 11.2b
Weale’s genetic distance map. Massive male Anglo-Saxon invasion was inferred from the observation that five English towns group with one another and with Friesland rather than with Wales. Problems of interpretation: the effect is not specific to Friesland, and there are better matches with Belgium and France (
Figure 11.4b
); plus there are other explanations, such as common previous regional colonization history. (Two-dimensional genetic distance map generated using the First and Second Principal Components in genetic analysis.)
From this summary of identity and difference, Weale and his colleagues proceeded to computer models of migration and splitting to determine the most likely scenarios and ‘to evaluate whether or not a large Anglo-Saxon migration event is needed to explain the extremely high Central English–Frisian affinity’. They then disposed of all but one of their alternative models as ‘straw men’ and mathematically unlikely, leaving the mass Anglo-Saxon migration with 100% replacement as the most likely event by default.
We can already see a few problems with this conclusion, apart from the size and number of Welsh sample sites. The ‘statistical significance’ tests required to make the inferences of ‘extremely high affinity’ rested on calculations based on only seven gene
groups
rather than the many gene
types
available to them.
23
While seven is nearly twice the four possible ABO blood groups, as we have seen, only two Y gene groups are really important in determining population mix throughout England, Wales and
Frisia: Ruisko and Ivan. This is not much better than the old blood group story. Furthermore, as mentioned in
Chapter 6
, PCA analysis gives no dates or direction to gene flow. The study effectively increases the inherent risk of making prehistoric judgements of migration based on genetic distance rather than using a phylogeographic approach, as I have done in this book.
Also, Weale and colleagues effectively set up Norway and Friesland as alternative primary sources of migration from the Continent rather than exploring the possibility they were already mixed populations themselves (my first model). As we have seen in this book, the main Basque refuge group, R1b (Ruisko) dominated Western Europe because he was the first colonizer to arrive after the Ice Age, coming up from Iberia and the Basque Country. Ivan did not arrive in north-west Europe until much later, during the Mesolithic or Neolithic, and seems to have spread as a relative minority rather evenly across northwest Europe, including Frisia and into eastern Britain.
In other words, Frisia, Saxony and England could each have received rather similar secondary admixtures of specific Neolithic Ivan intruders, and then retained the same mix ever since. This ‘staged parallel mixing’ scenario (my first model) seemed to have occurred to Watkin and Mourant over fifty years ago, but was not tested for by Weale. As they say, ‘We note, however, that our data do not allow us to distinguish an event that simply added to the indigenous Central English male gene pool from one where indigenous males were displaced elsewhere or one where indigenous males were reduced in number,’ although it is not clear what timescale of ‘events’ is implied in their comment.
Subsequent papers written by members of Weale’s group appear to have diverged somewhat in their adherence to the 2002
conclusions. One of them has taken the idea of total replacement as ‘given’ and proceeded to work out how Frisian Y chromosomes could so effectively have replaced British ones, for instance postulating a male apartheid.
24
Others have taken a second look at the conclusions by extending the dataset massively to include samples obtained systematically from throughout the British Isles, and further samples from Scandinavia and the putative Anglo-Saxon homelands of Schleswig-Holstein in the Cimbrian Peninsula and part of north-west Germany at its base. This latter approach, adopted by Italian geneticist Cristian Capelli and colleagues,
25
working at University College London at the time, has incidentally supplied the bulk of the public domain British Y-chromosome data I have used in this book.
In his introductory paragraph Capelli acknowledges conclusions of an earlier paper published by Orcadian geneticist Jim Wilson and other members of the same group,
26
who used the similarity of Basque and Celtic Y chromosomes to argue for genetic continuity in British indigenous populations from the Upper Palaeolithic to the present. This preamble introduces Capelli’s view of a substantial genetic retention of Basque gene types in ‘the indigenous population of the British Isles [including England]’.
In the analysis, Capelli represents the indigenous or aboriginal pole (meaning the extreme indigenous part of the genetic distribution on the genetic distance map – see upper left-hand corner in
Figure 11.3a
) by a sample from Castlerea, ‘a site in central Ireland that has had no known history of contact with Anglo-Saxon or Viking invaders’. He did not assume that Frisia was the
putative Anglo-Saxon homeland, instead using a combination of samples from Denmark, Schleswig-Holstein and north-west Germany (referred to below as NGD, for northern Germany and Denmark) as representative of the invaders.
27
They included an enlarged sample from Norway and marginally improved the resolution of their analysis by adding three STR clusters to the existing eleven gene groups, thus making fourteen.
28
Like Weale and colleagues, Capelli’s group also used Principal Components Analysis to produce a genetic distance map of the populations sampled in their study (
Figure 11.3a
).
29
Capelli and colleagues note two other poles of distribution in their genetic distance plot: one in the bottom middle of the plot, representing NGD, and the other at the top right, occupied by ‘Norway’. This plot gives a rather different perspective on the English, and specifically of their relationship with Continental ‘sources’, from that in the Weale paper. In their words, it
