The Origins of the British: The New Prehistory of Britain (55 page)
Read The Origins of the British: The New Prehistory of Britain Online
Authors: Oppenheimer

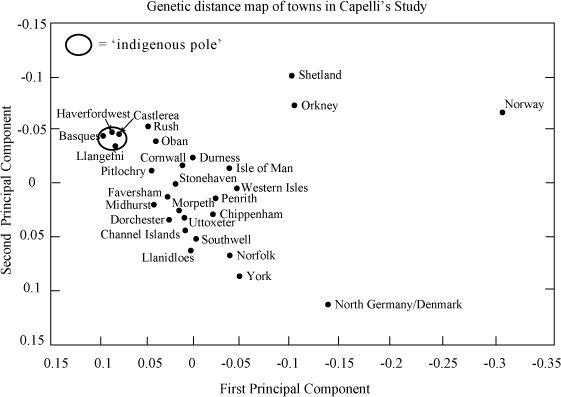
Figure 11.3a
Capelli’s genetic distance map. The degree of Anglo-Saxon male invasion or (vice versa) ‘indigenous’ survival, inferred from relative genetic position between northern Germany/Denmark and Ireland. Problems of interpretation: the effect is not specific to northern Germany/Denmark, and there are better matches with Belgium, France and Friesland (
Figure 11.4b
); plus there are other explanations, such as common previous regional colonization history. (Two-dimensional genetic distance map generated using the First and Second Principal Components in genetic analysis.)
provides significant evidence that there has not been complete population replacement anywhere in the British Isles … Perhaps the most surprising conclusion is the limited continental input in southern England, which appears to be predominantly indigenous and, by some analyses, no more influenced by the continental invaders than is mainland Scotland.
30
Overall, using NGD as their source region for migration, they estimate the degree of Continental intrusion (admixture) to England at 37%, although this figure rises to over 70% in Norfolk and York (
Figure 11.3b
).
31
We could well ask – I certainly did – why Capelli rejected Frisia as an alternative Continental source, and even as a point on their plot, if it was so much more like England in the Weale paper. In fact, they had considered using Frisian populations but did not consider them significantly different from NGD populations.
32
In the Weale paper, the
lack of significant genetic difference
between Frisians and English was used specifically to argue for holocaust. The Capelli paper, on the other hand, uses the
degree of difference
between the NGD sample and the ‘indigenous’ group to estimate Anglo-Saxon immigration. If groups of researchers with overlapping memberships decided to use Frisia as the source for migration in one study and obtained wipeout, and then used NGD as the source in another study and found less than 50% replacement, we may well be left wondering just why they chose different sources and inference methods and why they obtained different outcomes.
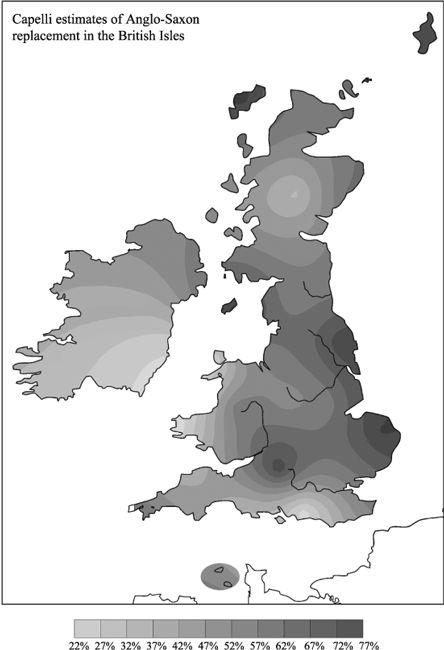
Figure 11.3b
Degree of north German and Danish male ‘introgression’ into the British Isles estimated by Capelli. According to these estimates, the Anglo-Saxon invasion penetrated much farther and was more massive than any historian’s claim. (Contour map generated from Capelli’s analysis.)
Naturally, both the Weale and Capelli reports provide some of the answers to these questions of method and definition. Weale and colleagues state that: ‘Friesland is thought to be one of the source locations for Anglo-Saxon immigration both because of its geographical location and because Frisian is considered to be the closest extant language to Old English.’ The Capelli group explain: ‘We also note that some historians view the Anglo-Saxons themselves as Germanic invaders from what is now North Germany/Denmark.’ So, apart from the linguistic link, both studies appeal to our notorious historians, the former to Procopius of Caesarea and the latter presumably to Gildas, as primary source.
Now, while it is important to try to test different historical migration views genetically, there are clearly several problems of method here. Apart from the choice of replacement estimation, the historical views of both baseline homeland assumptions are disputed, as are historical views of the replacement outcome. Furthermore, neither of these papers tested whether, as I have suggested, there are other, older reasons for the gross similarities of gene group frequency between the Low Countries of the Continent and those of eastern England.
The Capelli group does acknowledge some of these problems: ‘it should be emphasized that our analyses assume that we have correctly identified the source populations. If, for example, the real continental invaders had a composition more similar to the
indigenous British than our candidate sample set, our results would systematically underestimate the continental input.’ This last comment, however unconsciously, underlines the incompatibility in mathematical approach of the two papers.
There are broader-based sources of information on the male gene group genetic mix of Western Europe which allow us to put the Low Countries of Saxony, Frisia, the Netherlands and Belgium in their place in a larger European picture. Perhaps the most comprehensive of these, which also allows us to compare European populations with the detailed information available on the British Isles, is a massive study published in 2000 by Zoë Rosser and numerous collaborators.
33
Their study creates a similar genetic distance plot of European male gene groups, using the first and second principal components. This plot clearly shows a simple triangular distribution of populations, with three extreme poles. Not surprisingly, given the discussion in the first half of this book, one of these poles is Basque and the other two are Balkan and northern Baltic (
Figure 11.4a
). This pattern fits with the male genetic influence from the two former Ice Age refuges of Iberia, from the Black Sea/Balkan region with the third pole representing later gene flow to the Scandinavian Peninsula, the Baltic and north-east Europe, ultimately from the Ukrainian refuge.
The West European genetic landscape thus seems informative and rather uncomplicated at the level of the male gene groups used in the Rosser study. In this book I have argued for there being three sources of post-LGM north-west European colonization, the oldest and largest input being from the Iberian refuge, followed by a Balkan input up the Danube during the Mesolithic/Neolithic, and then the Scandinavian/Baltic influence coming in mainly during the Neolithic. There are other interpretations, of course, with different timescales, but it is difficult to see how they could affect the details of the Basque pole, which shows the extraordinarily tight genetic conservatism of Western Europe. In Rosser’s work, the closest population to the Basques is in Cornwall, followed closely by Ireland, Scotland, Spain, Belgium, Portugal, East Anglia and then northern France. At this point the triangle starts to spread, with Mediterranean countries on the lower border as we move towards the Balkan pole in the south-east, and Germanic-speaking countries on the upper-left border as we move towards the Baltic pole. The northern Scandinavian countries cluster predictably on the upper border, roughly equidistant between the Basque and northern Baltic. Germany is also far up that line, and near northern Scandinavia.
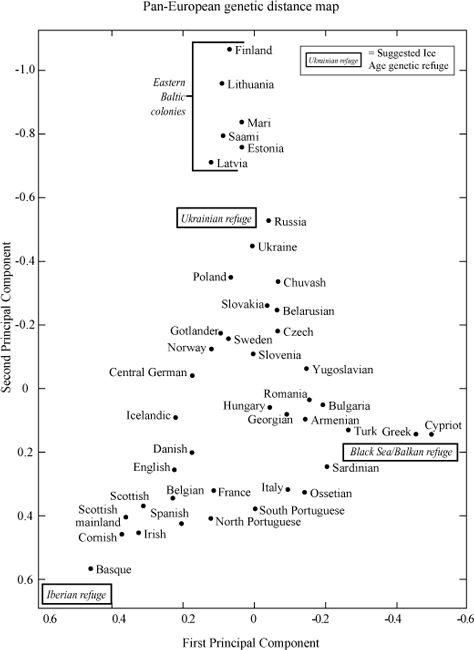
Figure 11.4a
Rosser’s genetic distance map of all of Western Europe, showing three main sources of male gene flow. Ice age refuges in Iberia, the Balkans/Black Sea and the Ukraine regions form the main poles of the pan-European genetic distribution map, with the eastern Baltic region as an outlier to the Ukrainian pole. Locations in the British Isles, including England, group near the Iberian pole, along with France and Belgium. (Two-dimensional genetic distance map generated using the First and Second Principal Components in genetic analysis.)
When we look more closely at the countries bordering the North Sea on Rosser’s plot, we find that East Anglia is no more ‘Germanic’ than the Netherlands or northern France, although more so than Belgium. Given the juxtaposition of these countries, and the absence of Frisia from this study and its crucial importance for the Weale argument, I decided to re-analyse the English dataset to look more closely at the mix in the Low Countries. To do this I included not only Frisia, Norway and
NGD, but all the other countries bordering the North Sea from Rosser’s study, using gene group markers common to all studies. For better detail in this analysis, I excluded Central and Eastern Europe (including the Balkans).
The results were interesting (
Figure 11.4b
). As found previously, Frisia linked very closely with the samples from Norfolk, and as expected also with Rosser’s East Anglia sample. This was a closer similarity than for the ‘Anglo-Saxon homeland’ of Schleswig-Holstein and north-west Germany and much closer than for Denmark, which, in contrast with Capelli’s results, grouped closer to southern Norway than to their north-west German sample. However, the Continental ‘Anglo-Saxon homeland’ defined in this way, without Denmark, is still considerably closer to Norfolk than to Denmark.
The real surprise was to find Belgium moving farther west into England than Frisia or the rest, and nestling into a group consisting of the three central English towns of Weale’s transect line – as if to bear out Caesar’s claim that some English regions were more Belgian than British. Northern France and the Netherlands, although bordering the English samples, were all much closer to England than Denmark or Rosser’s central German sample.
So many independent indications of Continental similarity with England is what we should expect if the Low Countries of north-west Europe all had similar colonization histories. This view of parallel regional development makes much more sense than Weale’s interpretation of ‘cleansing’ by similarity which, if extended, would conclude that each and any of the Low Countries could have wiped out Britons, as was claimed for Frisia.
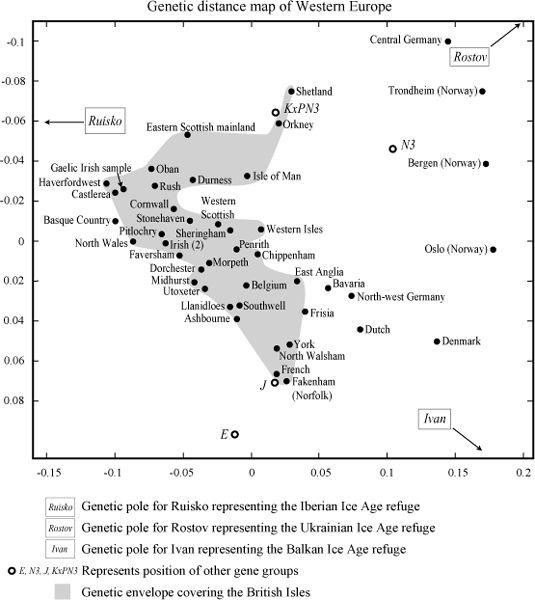
Figure 11.4b
We are all family’ – or are Belgians more English than the English? Put in the context of the whole of Western Europe, the mix in the south-eastern male British genetic distribution (lower part of the shaded area) fits best with Belgium, followed by France, Frisia and Bavaria, rather than north-west Germany and Denmark. The simplest explanation for this regional similarity is a common regional prehistory of colonization, rather than recent invasions. (Two-dimensional genetic distance map generated using the First and Second Principal Components in genetic analysis. North-west European data in
Figure 11.4a
extended to include dataset used in this book.)