The Washington Manual Internship Survival Guide (18 page)
Read The Washington Manual Internship Survival Guide Online
Authors: Thomas M. de Fer,Eric Knoche,Gina Larossa,Heather Sateia
Tags: #Medical, #Internal Medicine

Escape Rhythms
•
Stimulation of the His-Purkinje system and the ensuing QRS complex is driven by the fastest active intrinsic pacemaker within the heart. Usually, this is the sinus node.
•
In the event of sinus node failure, the AV node’s pacemaker may resume pacemaking responsibilities for the heart, resulting in a junctional rhythm.
Junctional rhythm
can be recognized when a narrow-complex QRS (or a QRS similar to the one caused by sinus rhythm) arises without any detectable atrial activity (p-waves). The rate is usually between 40 and 60 bpm.
•
In the event of failure of both the junctional and sinus pacemakers, pacemakers within the ventricle may resume pacemaking responsibilities. If this occurs, the rhythm is termed
idioventricular rhythm
. Because the pacemakers are located within the ventricle, conduction does not necessarily occur through the His-Purkinje system, and the QRS complex is wide. The rate is typically around 40 bpm. Thus, idioventricular rhythm can be identified by a wide, regular, and slow rhythm that occurs in the absence of atrial activity.
•
Treatment is the same as for patients with third-degree heart block
. Your resident or fellow should be called, and plans for increasing the heart rate using drugs such as dopamine or dobutamine or temporary pacing should be considered.
MYOCARDIAL ISCHEMIA
•
Remember to keep the clinical picture in mind when interpreting ECGs. In the symptomatic patient, very subtle ECG changes could represent significant ischemia. Likewise, in the asymptomatic patient, consider whether you would have ordered an ECG in the first place. As always, if you are unsure, ask for help!
•
When confronted with a patient with suspected ischemia, it is always useful to obtain an old ECG for comparison! If the old ECG is normal, interpretation of the new ECG is less complicated. Often, the patient will have baseline abnormalities on the old ECG, and changes from that baseline could represent a pathologic process.
ST Segment and T-waves
•
Myocardial ischemia is characterized by symmetric T-wave inversion, flat or downsloping ST depression, or both.
•
ST elevation MI (STEMI), representing severe ischemia, will present with ECG changes as shown in Figure 19-9, depending on when in the pathological process the ECG is taken.
•
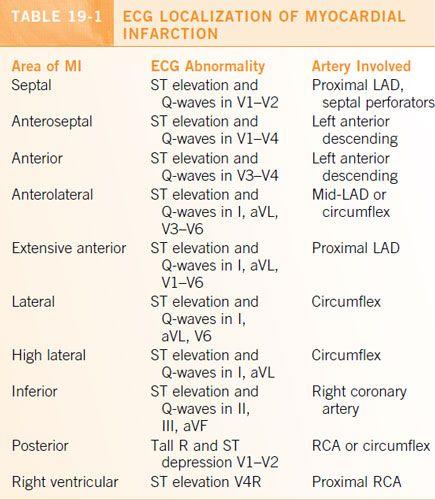
The distribution of leads in which ECG changes representing ischemia are observed can often help localize the region of myocardium that is ischemic (
Table 19-1
).
•
If changes are observed in leads
I and aVL, ischemia likely involves the high lateral wall
; the culprit vessel is typically a proximal diagonal artery or the circumflex artery.
•
If changes are observed in leads
II, III, and aVF, ischemia likely involves the inferior wall
; the culprit lesion is likely in the distal circumflex artery or mid- to distal right coronary artery.
•
Changes in leads
V1–V2 represent the septal region
of the heart; consider a left main or proximal LAD lesion.
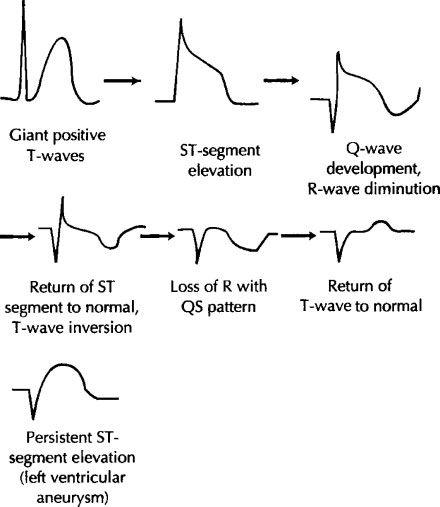
Figure 19-9.
ST and T-wave changes in STEMI.
•
Changes in
V3–V5 represent a continuum of myocardium extending from the anterior LV to lateral LV
; consider mid- to distal LAD and proximal to mid-circumflex lesions.
•
In a symptomatic patient,
a new LBBB could represent severe ischemia
, and you should immediately call for help!
•
Keep in mind that in patients with known LBBB, there should be some anteroseptal ST segment elevation and lateral ST segment depression. Likewise, in RBBB, there should be some anteroseptal ST depression. Absence of these changes could represent ischemia in the symptomatic patient with known bundle branch block and warrant further workup.
•
Similarly, patients with LVH or on digoxin (
Figure 19-10
) will often have lateral ST segment depression, and interpretation of those changes as ischemic or nonischemic must be made taking into account all clinical factors (e.g., symptoms) and laboratory values (e.g., cardiac enzymes).
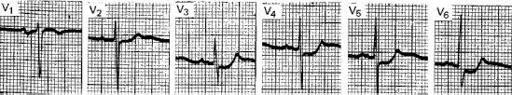
Figure 19-10.
Digitalis effect.
R-Waves
•
The utility of precordial R-waves in interpreting ECGs is often underappreciated.
•
Examining leads V1–V6 sequentially, the R-wave should be larger than the S-wave by lead V3, and larger in each subsequent lead than the previous. If this pattern is not present, the patient is said to have poor R-wave progression.
•
The differential for
poor R-wave progression
includes obesity, incorrect lead placement, and pulmonary disease; however, in the setting of a patient who is suspected of having myocardial ischemia, poor R-wave progression could represent the equivalent of a q-wave. The interpretation of an ECG with poor R-wave progression should read “cannot rule out anterior infarct, age indeterminate.” As always, interpret the ECG in the setting of all clinical and laboratory information at hand.
•
The true posterior region of the myocardium is poorly represented on the standard 12-lead ECG. The presence of an R-wave in lead V1 with ST depression should alert the clinician to a possible STEMI of that region of the heart. Call for help if you note this ECG finding in the symptomatic patient!
Q-Waves
•
Pathologic q-waves are longer than 40 ms in duration and larger than one third the QRS amplitude or one fourth the R-wave amplitude.
•
Q-waves usually represent a region of the myocardium that has suffered an infarct in the past.
•
However, as always in the symptomatic patient, your threshold for recognizing a change as acute should be higher, and close attention should be paid to newly found q-waves.
Management
•
Management of acute myocardial ischemia should usually involve your resident. Aspirin 162 mg PO is always a good starting point.
•
As internists, there is no medicine we give that affects mortality as significantly as aspirin in the setting of acute MI!
Conditions Mimicking STEMI
•
ST elevations in the symptomatic patient should be treated as STEMI until proven otherwise. Still, it is useful to know that certain other conditions will also cause ST elevations on the ECG.
•
Pericarditis will cause diffuse ST elevations
(
Figure 19-11
). Certain clues, however, can point away from the diagnosis of STEMI. Clinically, the patient may have the classic pericarditis presentation, with chest pain and shortness of breath that is relieved with leaning forward or with NSAIDs. The patient may also have features on history that predispose to pericarditis. On ECG, the ST elevations will often not follow a single arterial distribution. Classically, the ECG will also show depression of the PR segment.
•
Takotsubo cardiomyopathy can also cause diffuse ST elevations
. Takotsubo cardiomyopathy is an increasingly recognized condition that occurs during periods of great emotional or physiological stress; patients present with symptoms identical to that of acute MI. In addition to ST elevations, segmental myocardial wall motion abnormalities also occur. Typically, though Takotsubo cardiomyopathy occurs in the absence of pericardial coronary artery occlusion, cardiac catheterization is needed to make this diagnosis of exclusion.
•
A late sequel of a STEMI is the formation of
ventricular aneurysm
, which can also present with ST elevations. Clues to this diagnosis include the presence of ST elevations in a patient with recent STEMI but without new symptoms. The diagnosis is clinched with ventricular imaging such as echocardiography.
•
Severe hyperkalemia
, usually with levels greater than 5.5 mg/dL, can present with
sharply peaked T-waves
, imitating the changes found during the hyperacute phase of a STEMI (
Figure 19-12
). As hyperkalemia worsens, the QRS will widen. Strongly suspect hyperkalemia in the patient with known renal disease or on high doses of spironolactone, ACE inhibitors, or angiotensin receptor blockers. ECG changes should trigger immediate treatment of hyperkalemia, initially with 2 g IV calcium gluconate, followed by measures to drive potassium out of the intravascular space and eliminate it from the body.
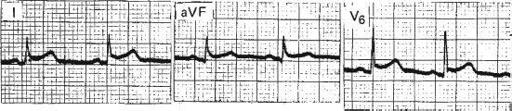
Figure 19-11.
Pericarditis.
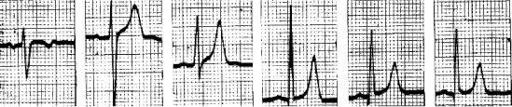
Figure 19-12.
Hyperkalemia.
RADIOGRAPHY
CHEST X-RAY