Nonplussed! (7 page)
Authors: Julian Havil

The graph of this function for
r
up to 100 is shown in
figure 3.2
.

Figure 3.2.
The probability of at least two coincident birthdays
Table 3.1.
The critical region.

The horizontal line drawn at 0.5 causes us to look at a value of
r
a little over 20 and
table 3.1
details the values in this region and, sure enough, 23 is the critical value for
r
. To the surprise of many and the shock of some it requires only 23 people to be gathered together for the odds to be in favour of at least two of them sharing a birthday.
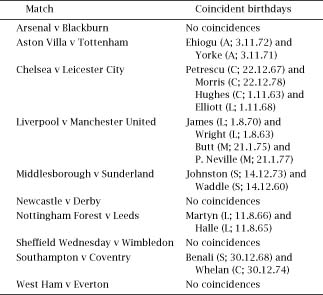
Putting the result into a tangible context, in each (English) football match of 11 players a side (plus a referee) the odds are in favour of two of the participants sharing the same birthday. Science journalist Robert Matthews provided some data to support the theory by choosing ten Premiership matches played on 19 April 1996 and establishing birthdays; the results are shown in
table 3.2
.
With a probability of success of about 0.51 theoretically we would have expected about 5 successes out of the 10 possible matches and we see that there were 6; not such a bad fit.
Table 3.2.
Data from ten premiership football matches.

Assumptions
Throughout, we have assumed that birthdays are evenly distributed throughout the year, which is convenient for our calculations but not strictly true. That said, it has been shown that (not unreasonably) nonuniformity increases the probability of a shared birthday (see, for example, D. M. Bloom (1973), A birthday problem,
American Mathematical Monthly
80:1141–42, and A. G. Munford (1977), A note on the uniformity assumption in the birthday problem,
American Statistician
31:119). T. Knapp examined the implications from an empirical viewpoint in his 1982 article, The birthday problem: some empirical data and some approximations,
Teaching Statistics
4(1):10–14. The empirical data were culled from birth-date information from
Monroe County, New York, over the 28-year-period 1941–1968 (the length of the cycle chosen to smooth out micro fluctuations): the discrepancy was minuscule.
Table 3.3.
Multiply shared birthdays.

What difference does a leap year make? Again, not very much. If we model the situation using a year of 365.25 days with the assumption that the probability of being born on 29 February is 0.25 of that on any other day, we have that the probability of a randomly selected person being born on 29 February is 0.25/365.25, and the probability that a randomly selected person was born on another specified day is 1/365.25. More (slightly more delicate) calculations reveal that 23 is again the magic number with the only difference that the associated probability is 0.5068….
Generalization
There are simple ways of generalizing the problem: for example, we might ask how many people are needed for the odds to be in favour of at least two of them being born in the same month, or having the same birth sign. Putting
n =
12 in the formula for
P
n
(r)
reveals that
r =
4 gives the probability as 0.427 083 … and
r =
5 gives it as 0.618 056 ….
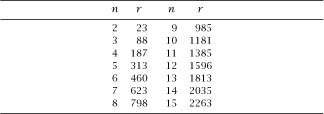
A question which is much harder to solve is to find the minimum number of people,
r
, for which the odds are in favour of at least 3,4,
…,n
of them sharing the same birthday. R. J. McGregor and G. P. Shannon (for example) gave such an analysis
using the theory of partitions in their 2004 paper, On the generalized birthday problem,
Mathematical Gazette
88(512):242–48. The first few values of
n
and
r
are given in
table 3.3
.
Finally, we might ask the probability that, among
r
people and with a year of 365 days, there is a ‘near-miss’ of birthdays. To be exact, we ask to calculate the probability

Again, this is quite a diffcult problem (see J. I. Naus (1968), An extension of the birthday problem,
American Statistician
22:27–29). His calculations reveal that

Matthews calculated this probability for birthdays either on the same day or on adjacent days (taking
d =
1) for the football example (taking
r =
23) to get the value 0.888 …. This means that we would expect about 9 of the 10 fixtures to possess this attribute; using his complete dataset he points out that, in fact, all 10 do.
Finally, this last formula can be used to calculate the minimum
r
for which

for any values of
d
.
Table 3.4
shows the results of calculating this probability for
d
between 0 and 7, with the first row of data reflecting the Birthday Paradox. The last row is rather surprising too; it says that in a family of six members it is more than likely that two of them will have a birthday within a week of each other.
Halmos’s Answer
The late Paul Halmos, who wrote, taught and inspired for decades, is quoted as saying that ‘computers are important, but not to mathematics’. In particular, in his autobiography,
I Want
to Be a Mathematician
, he deplored the fact that the Birthday Paradox is customarily solved by a computational method, for example, as shown in the section on the standard answer earlier in the chapter. He expressed the view that it was naturally susceptible to analysis and provided the following argument to justify the claim. The method also gives a useful asymptotic estimate of the probability for large
n
. It is also very pretty.
He stated in that autobiography that
Table 3.4.
Birthdays separated by up to a week.

A good way to attack the problem is to pose it in reverse: what’s the largest number of people for which the probability is less than 1/2 that they all have different birthdays?
In terms of our original notation this means that, for a given
n
, we require the largest
r
such that

