Nonplussed! (17 page)
Authors: Julian Havil

Figure 7.2.
Winning behaviour
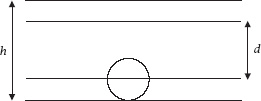
Figure 7.3.
The coin and ruled lines
To entice the player to double their money, a simple calculation shows that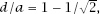 or a little less than this if we are to make a profit!
Moving from a square grid to sets of parallel lines makes the calculation even easier. If the lines are a constant distance
h
apart and the disc has a diameter
d
, it is clear from
figure 7.3
that the disc will land within a pair of lines if its centre lies in a band of width
h
−
d
and so the probability that this happens is

Our fair game would now force
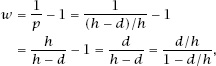
where
d
<
h
.
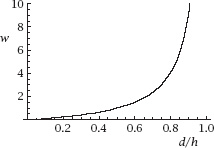
Figure 7.4.
Winning behaviour
A plot of
w
against
d
/
h
is given in
figure 7.4
.
Another simple calculation shows that, to double the stake,
d
/
h
= 1/2.
So far, these are geometric probabilities calculated in a reasonable manner to give reasonable answers. Now we move to the already heralded, seemingly simpler, but far more intriguing, case.
Buffon’s (Short) Needle
Buffon raised the question of throwing not a circular object, but an object of a different shape, such as a square, or a ‘baguette’ (a rod or stick), or, as he points out, ‘On peut jouer ce jeu sur un damier avec une aiguille à coudre ou une épingle sans tête.’ (‘You can play this game on a chequerboard with a sewing-needle or a pin without a head.’) It is said that he threw a classic French baguette over his shoulder onto a boarded floor to demonstrate a version of the idea. We come, then, to the phenomenon now universally known as Buffon’s Needle: if we throw a needle of length
l
on a board ruled with parallel lines, distance
d
(≥
l
) apart, what is the probability that the needle crosses one of the lines?
In the eighteenth and nineteenth centuries such experiments were common, with probability considered as something of an experimental science. We have seen De Morgan detail the efforts of Mr Ambrose Smith of Aberdeen; this and the efforts of De Morgan himself are included in a table in the 1960 article, Geometric
probability and the number
π
(
Scripta Mathematica
25(3):183–95) by N. T. Gridgeman. This is reproduced in
table 7.1
, with the relative length of the needle and gap equal to
l
/
d
.
Table 7.1.
The number of repetitions is
R
, the number of crossings is
C
, and the estimated value of
π
.
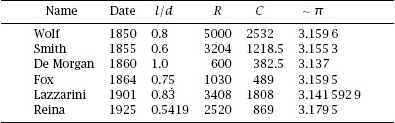
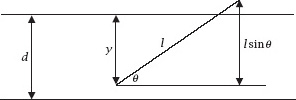
Figure 7.5.
The needle crossing a line
With all of this experimental data, it is time to look into the mathematics of all of this.
Figure 7.5
shows the needle crossing one of the horizontal lines at an angle θ to the positive
x
-direction. If we define
y
to be the distance of the lower end of the needle from the line which has been crossed, it must be that and also
 The vertical distance of the lower end to the upper end of the needle is
l
sin
θ
and for the needle to cross the line it must be that
l
sin
θ
>
y
.
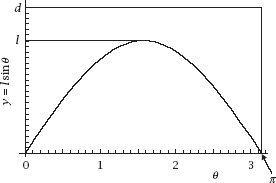
figure 7.6
shows a plot of the rectangular ‘phase space’ for the experiment, together with the curve
y
=
l
sin
θ
: crossings are achieved at all points underneath and on the curve.
To calculate the probability of a crossing we need to calculate the fraction